


Fornitore ufficiale
In qualità di distributori ufficiali e autorizzati, forniamo licenze software legittime direttamente da più di 200 autori di software.
Vedi tutte le nostre marche
Continua a leggere in inglese:
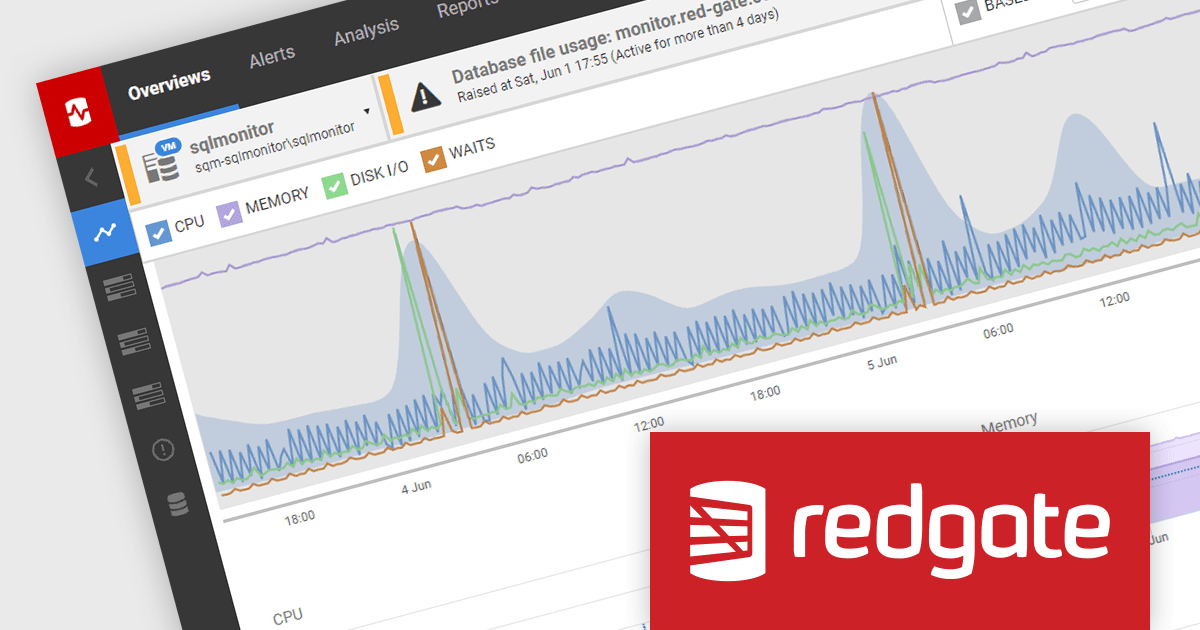
SQL Monitor is a database monitoring tool that helps you quickly identify and fix performance problems on a variety of platforms, including SQL Server and PostgreSQL. It provides real-time monitoring, alerting, root cause analysis, and performance tuning recommendations. SQL Monitor can be used by database administrators, developers, and operations teams to improve the performance of their databases.
SQL Monitor 13.0.54 bolsters its analysis capabilities by introducing I/O throughput metrics for both machines and databases. This addition empowers users with a more comprehensive view of performance, allowing them to analyze I/O throughput alongside existing metrics like CPU utilization, memory usage, and query wait times. This holistic perspective facilitates pinpointing the root cause of performance issues more efficiently. For example, high I/O wait times combined with high throughput could signify a physical disk bottleneck, whereas low throughput might point towards under-provisioned storage.
To see a full list of what's new in version 13.0.54, see our release notes.
SQL Monitor is licensed per server on an annual subscription basis. Each Server License will enable you to monitor either 1 Server (Multiple instances) or 5 Azure SQL Databases, or 1 Cloud (PaaS) instance, or 1 Cluster node. See our SQL Monitor licensing page for full details.
For more information, visit our SQL Monitor product page.


Tel: (888) 850 9911
Fax: +1 770 250 6199


