


Fornitore ufficiale
In qualità di distributori ufficiali e autorizzati, forniamo licenze software legittime direttamente da più di 200 autori di software.
Vedi tutte le nostre marche
Continua a leggere in inglese:
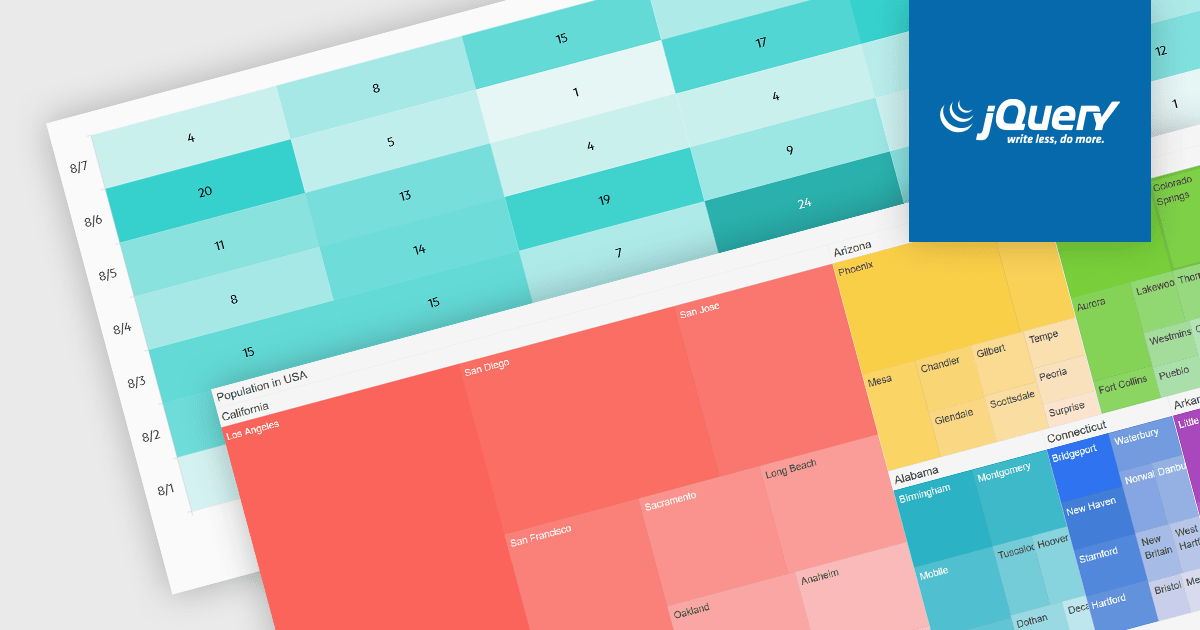
Heatmaps and treemaps are powerful data visualization tools that offer specific advantages when examining large datasets. A heatmap colorizes data values in a matrix, allowing for intuitive observation of trends, patterns, and outliers over two dimensions, making it helpful for spatial data analysis and correlation assessment. Treemaps exhibit hierarchical data as nested rectangles, with size and color variations indicating distinct quantitative values, allowing for effective use of space and fast comparison of proportions and relationships within hierarchical structures. Together, these chart types provide significant tools for visualizing and interpreting complex data, improving decision-making processes by presenting underlying data insights in a clear and actionable manner.
Several jQuery chart controls support the Heat and Treemap chart types, including:
For an in-depth analysis of features and price, visit our comparison of jQuery chart controls.


Tel: (888) 850 9911
Fax: +1 770 250 6199


