Visualizza le tendenze insieme ai dati corrispondenti

Maggio 17, 2024
L'aggiunta di grafici sparkline alle griglie consente agli utenti di identificare i modelli tra righe e colonne, consentendo un'analisi rapida e approfondita di set di dati di grandi dimensioni.

Continua a leggere in inglese:

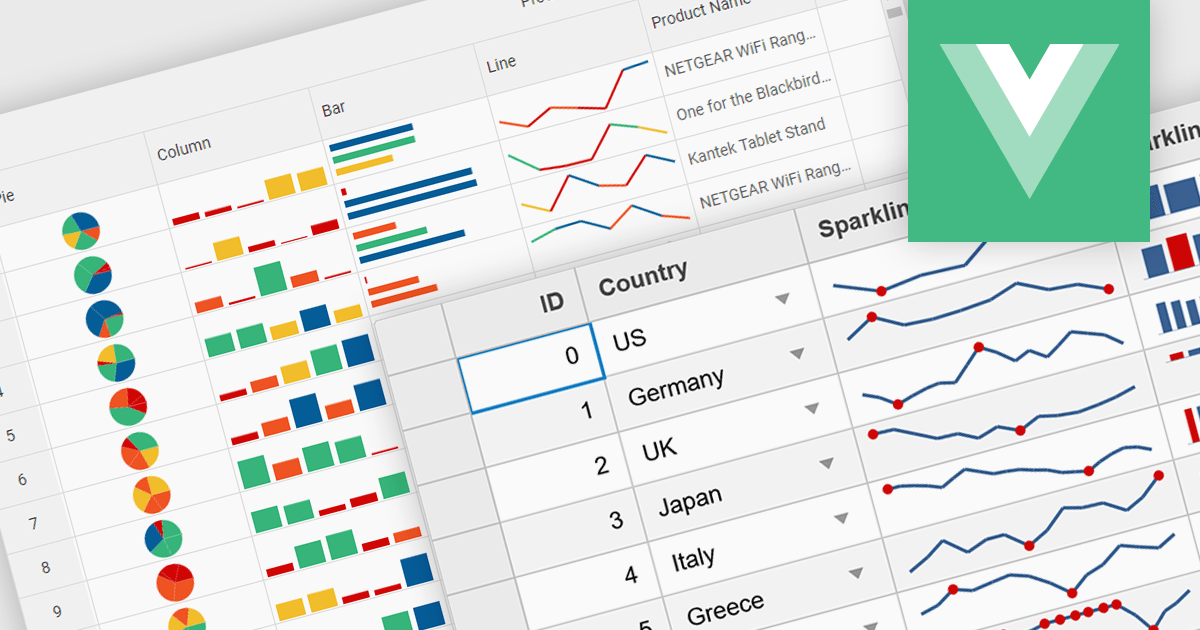
Sparklines are miniature charts embedded directly within grid cells, providing a quick visual summary of data trends within a larger dataset. These tiny line graphs, often lacking axes or detailed labels, condense information into a highly space-efficient format, allowing viewers to grasp patterns and fluctuations at a glance across multiple rows and columns of a grid.

Several Vue.js grid controls offer support for sparklines including:

  • Kendo UI for Vue Grid (part of Kendo UI by Telerik) empowers developers to integrate insightful sparklines within Vue grids, offering a concise view of data trends.
  • Wijmo FlexGrid (part of Wijmo by MESCIUS) facilitates data exploration through sparklines embedded directly in cells, enhancing visual analysis without overwhelming users.
  • Jspreadsheet Pro Data Grid offers a robust data manipulation platform, where sparklines can be incorporated into cells to visually represent data trends.
  • Smart HTML Elements Grid allows developers to seamlessly integrate sparklines into grids, enabling users to gain quick insights from data fluctuations.
  • Syncfusion Grid control for JavaScript (part of Syncfusion Essential Studio Enterprise) lets you leverage sparklines for efficient data pattern recognition within the grid.

For an in-depth analysis of features and price, visit our Vue.js Grid controls comparison.

Compare Vue.js Grid Controls