


Fornitore ufficiale
In qualità di distributori ufficiali e autorizzati, forniamo licenze software legittime direttamente da più di 200 autori di software.
Vedi tutte le nostre marche
Continua a leggere in inglese:
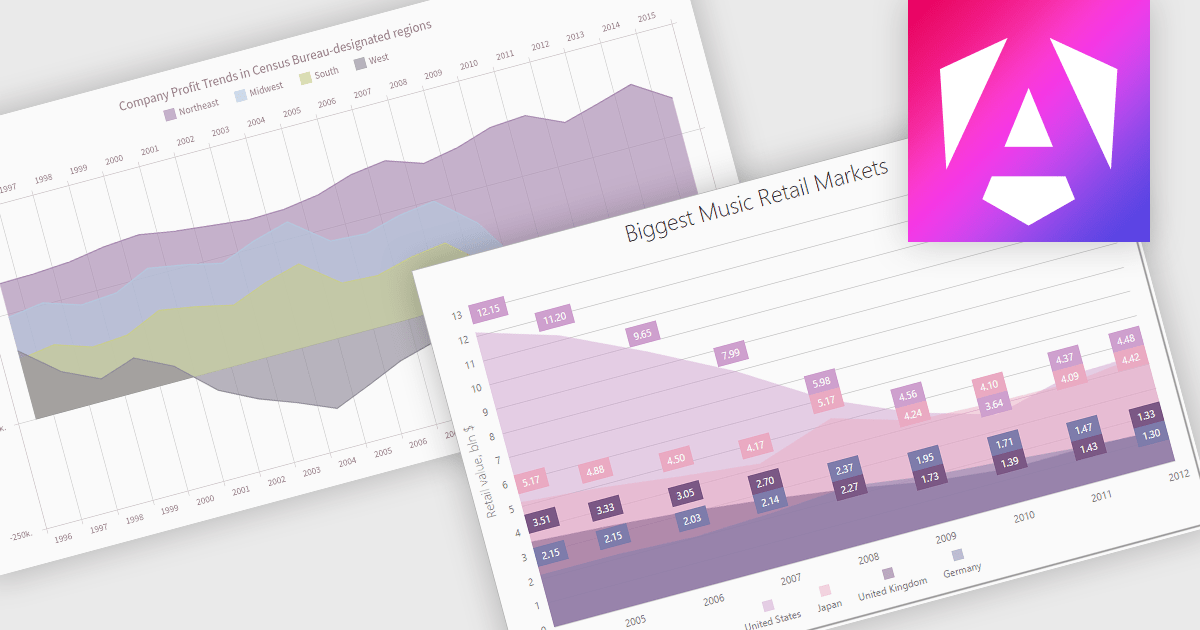
An area chart is a visualization tool that displays data as a filled area bounded by a line and the x-axis. It's particularly effective for illustrating trends and changes in data over time. By filling the area beneath the line, it visually represents the cumulative value of the data, making it easier to understand overall trends. This makes area charts ideal for visualizing metrics like sales over time, inventory levels, or stock prices.
Several Angular chart controls offer area charts including:
For an in-depth analysis of features and price, visit our Angular chart controls comparison.


Tel: (888) 850 9911
Fax: +1 770 250 6199


