


Fornitore ufficiale
In qualità di distributori ufficiali e autorizzati, forniamo licenze software legittime direttamente da più di 200 autori di software.
Vedi tutte le nostre marche
Continua a leggere in inglese:
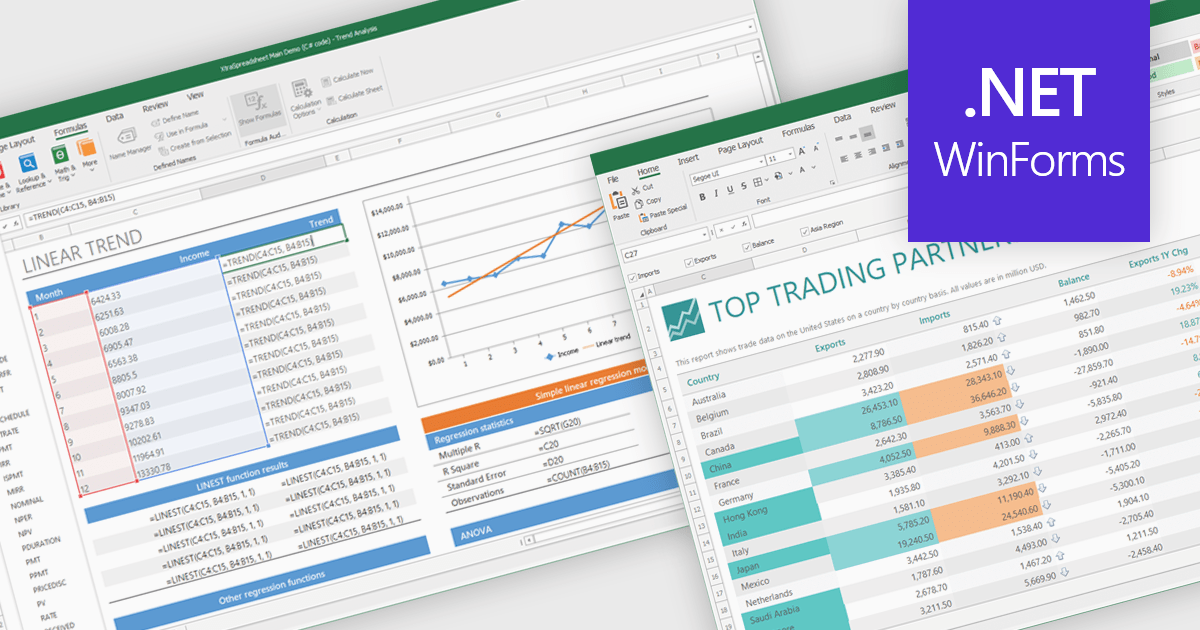
Chart support in a spreadsheet component refers to the ability to create, render, and manipulate various types of charts - such as line, bar, pie, and area charts - all within the spreadsheet environment. This functionality allows spreadsheet developers to present data visually and dynamically, without needing to rely on external charting libraries. The integration of charting capabilities enhances the end-user experience by making complex data more understandable. For developers, this reduces the need for separate visualization components, improves performance through tighter integration, and simplifies the deployment of data-centric applications.
Several .NET Winforms spreadsheet controls offer chart support, including:
For an in-depth analysis of features and price, visit our .NET Winforms spreadsheet controls comparison.


Tel: (888) 850 9911
Fax: +1 770 250 6199


