


Fornitore ufficiale
In qualità di distributori ufficiali e autorizzati, forniamo licenze software legittime direttamente da più di 200 autori di software.
Vedi tutte le nostre marche
Continua a leggere in inglese:
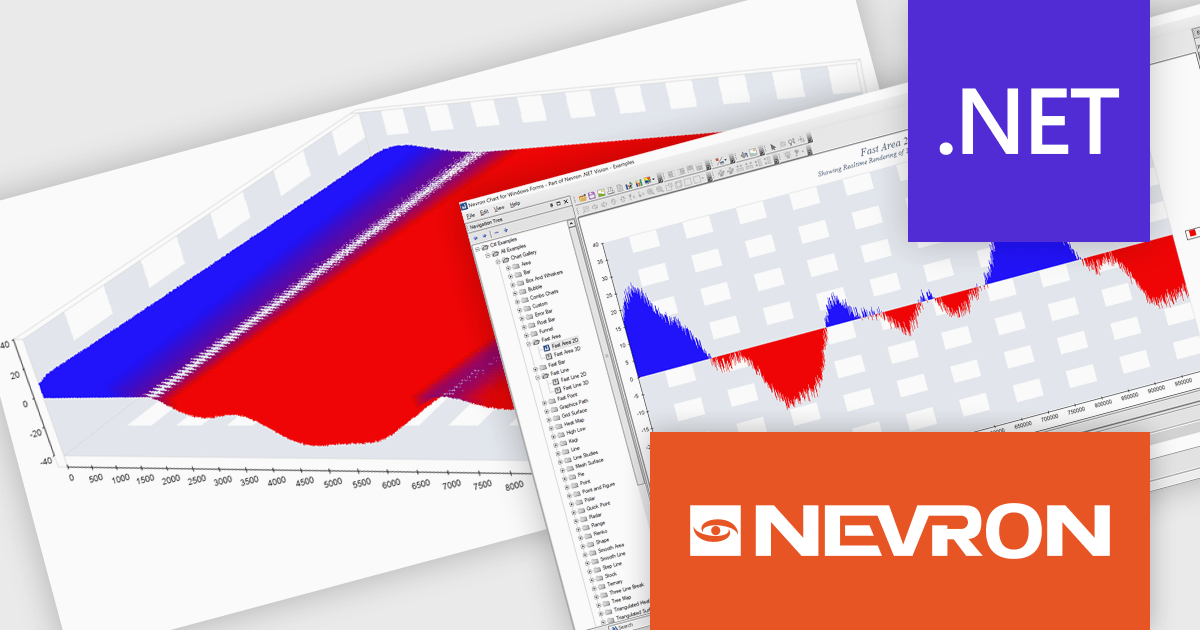
Nevron Chart for .NET is an advanced component suite designed for developers to add rich charting functionality to WinForms, WPF, ASP.NET and MVC applications. Covering any data visualization requirements it is an ideal solution for developing charting enabled presentation, business, scientific or financial applications. It boasts hardware acceleration for optimal performance, a flexible API for customization, and advanced interactivity features like zooming, panning, and tooltips to enhance user engagement with your data.
The Nevron Chart for .NET 2025.1 update introduces the new 'NFastAreaSeries', enabling real-time rendering of millions of data points using GPU acceleration. This addition significantly enhances performance for area charts, making it well-suited for high-volume data visualization scenarios. It complements existing fast-rendering series and includes optimizations that improve rendering efficiency across both imperial and metric units. Combined with automatic culture-based unit selection, the update ensures a responsive and localized user experience for developers building advanced data visualization applications.
To see a full list of what's new in 2025.1, see our release notes.
Nevron Chart for .NET is licensed per developer machine and is available as a perpetual license with 1 year subscription and support. See our Nevron Chart for .NET licensing page for full details.
Nevron Chart for .NET is available to buy in the following products:


Tel: (888) 850 9911
Fax: +1 770 250 6199


