


Fornitore ufficiale
In qualità di distributori ufficiali e autorizzati, forniamo licenze software legittime direttamente da più di 200 autori di software.
Vedi tutte le nostre marche
Continua a leggere in inglese:
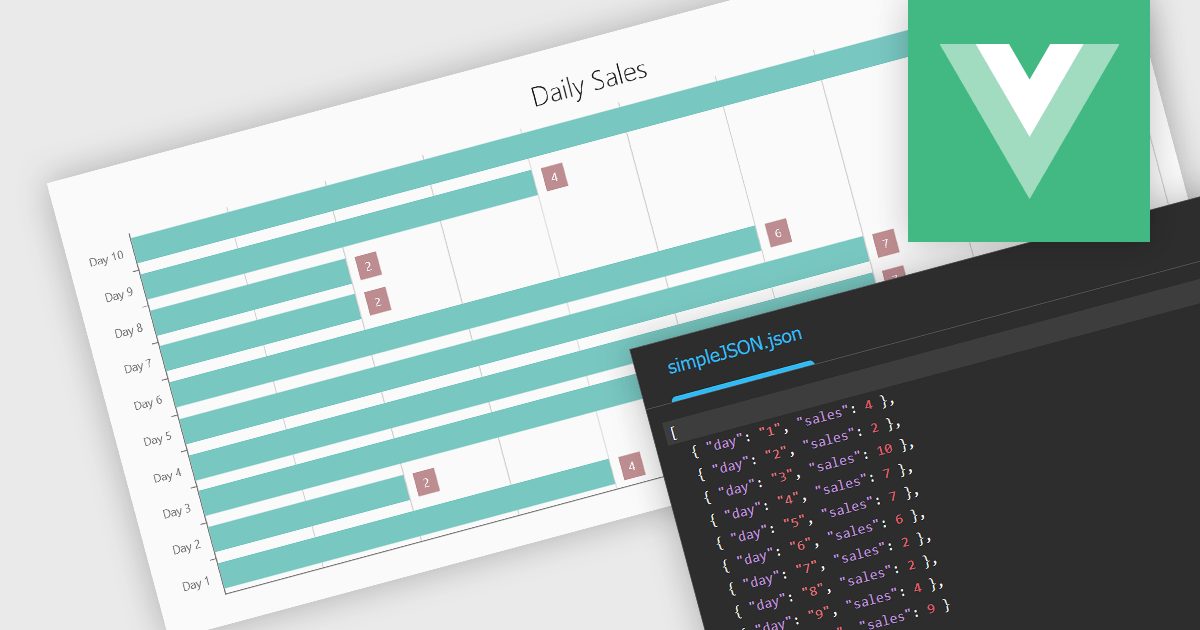
Using JSON (JavaScript Object Notation) as a data source for charts allows applications to bind structured, lightweight data directly to visualization components. JSON represents data as objects and arrays, making it well suited to defining categories, series, and individual data points in a format that aligns naturally with modern web development practices. Its widespread use in RESTful APIs and web services enables charts to consume live or remote datasets efficiently, while reducing the need for complex data transformation before rendering.
Several Vue.js chart components allow you to use JSON as a data source, including:
For an in-depth analysis of features and price, visit our comparison of Vue.js charting components.


Tel: (888) 850 9911
Fax: +1 770 250 6199


