


Fornitore ufficiale
In qualità di distributori ufficiali e autorizzati, forniamo licenze software legittime direttamente da più di 200 autori di software.
Vedi tutte le nostre marche
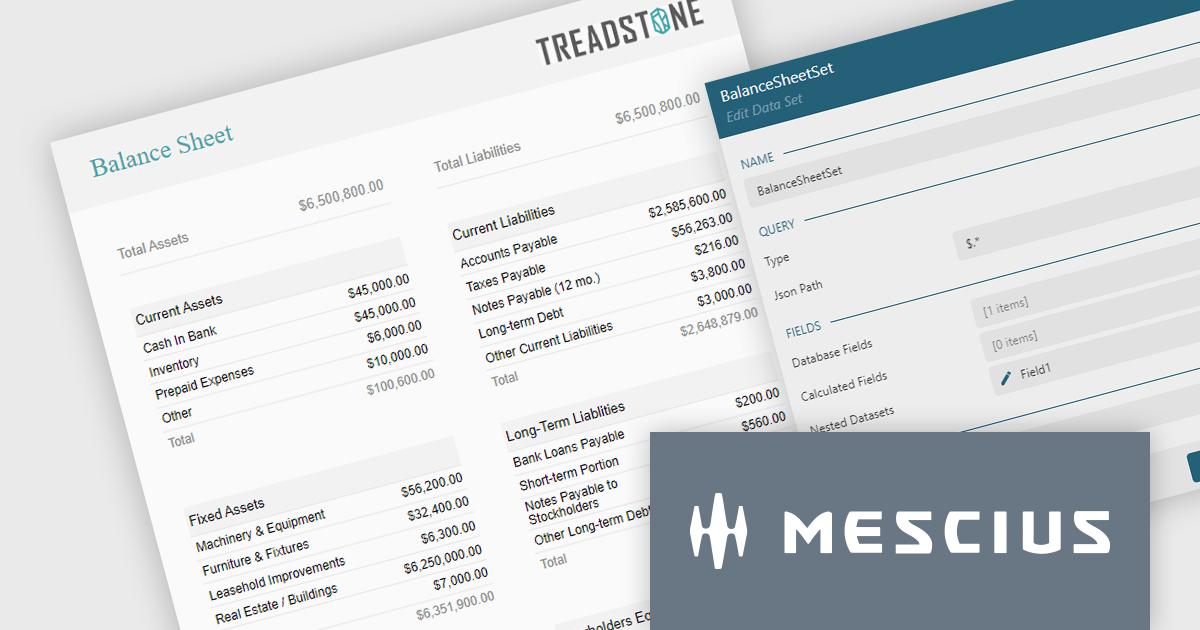
ActiveReportsJS is a powerful JavaScript reporting tool that allows developers and report authors to easily design and display reports within their web applications. With features such as drill-down, runtime data filtering, and interactive parameters, as well as compatibility with popular frameworks, ActiveReportsJS simplifies the process of creating and managing reports. Using the ActiveReportsJS Angular report designer component, many different types of data can be visualized, including financial reports (such as balance sheets) in a web application.
In this blog post, MESCIUS Technical Engagement Engineer Joel Parks shows you how to use the Angular Report Designer to design a balance sheet which can then be viewed in ActiveReportsJS's Angular Report Viewer. Steps include:
Read the full blog to get started using balance sheets to easily present a summary of a company's financial health and stability.
ActiveReportsJS is licensed on an annual subscription or perpetual basis and is available as a Single Deployment License for non-commercial use, and as a Single Domain License or Unlimited Domain License for commercial and/or SaaS use. See our ActiveReportsJS licensing page for full details.
For more information, visit our ActiveReportsJS product page.
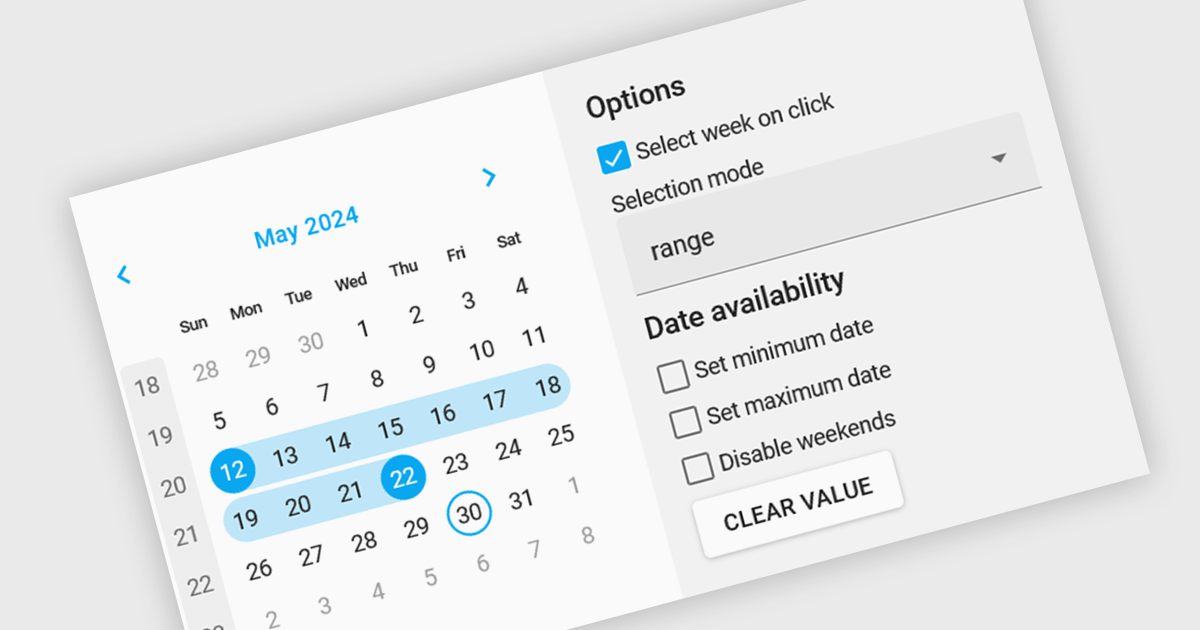
Calendar editing components provide a specialized way to interact with date and time data within the editor. These controls replace the standard input field with a visual calendar interface, allowing developers to offer a more intuitive and user-friendly experience for date selection and modification. This can significantly improve data entry accuracy and efficiency, especially when dealing with large datasets or complex date formats.
Several Angular data editor collections offer calendar editor controls including:
For an in-depth analysis of features and price, visit our Angular Data Editors comparison.
jQWidgets is a comprehensive JavaScript UI framework offering a robust collection of over 60 widgets, themes, and utilities for building professional-grade, cross-platform web applications. Built on jQuery, HTML5, and CSS, it provides extensive functionality including data grids, charts, navigation, input validation, and more. jQWidgets simplifies web development, ensuring your applications work seamlessly across desktop browsers, tablets, and smartphones.
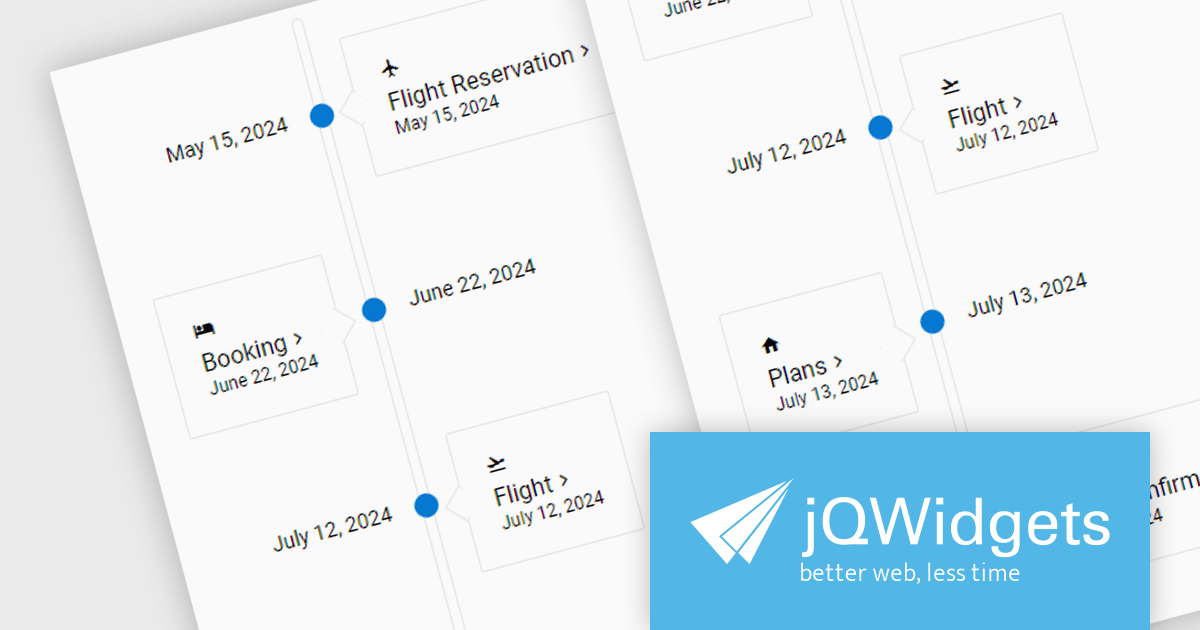
The jQWidgets 19.2 release adds the new jqxTimeline component. This allows for the visualization of events and activities in chronological order, aiding users in comprehending the flow and relationships between them. The timeline offers features such as chronological display, interactive elements for navigation and exploration, customizable styling for seamless application integration, support for rich content including text, images, and videos, and responsiveness for optimal viewing across various devices. These functionalities make the timeline component a valuable tool for applications in project management, historical references, education, and personal storytelling, by providing an engaging and clear way to present time-based information.
To see a full list of what's new in 19.2.0, see our release notes.
jQWidgets is licensed per developer and is available as a Perpetual license 1 year support and maintenance. See our jQWidgets licensing page for full details.
Learn more on our jQWidgets product page.
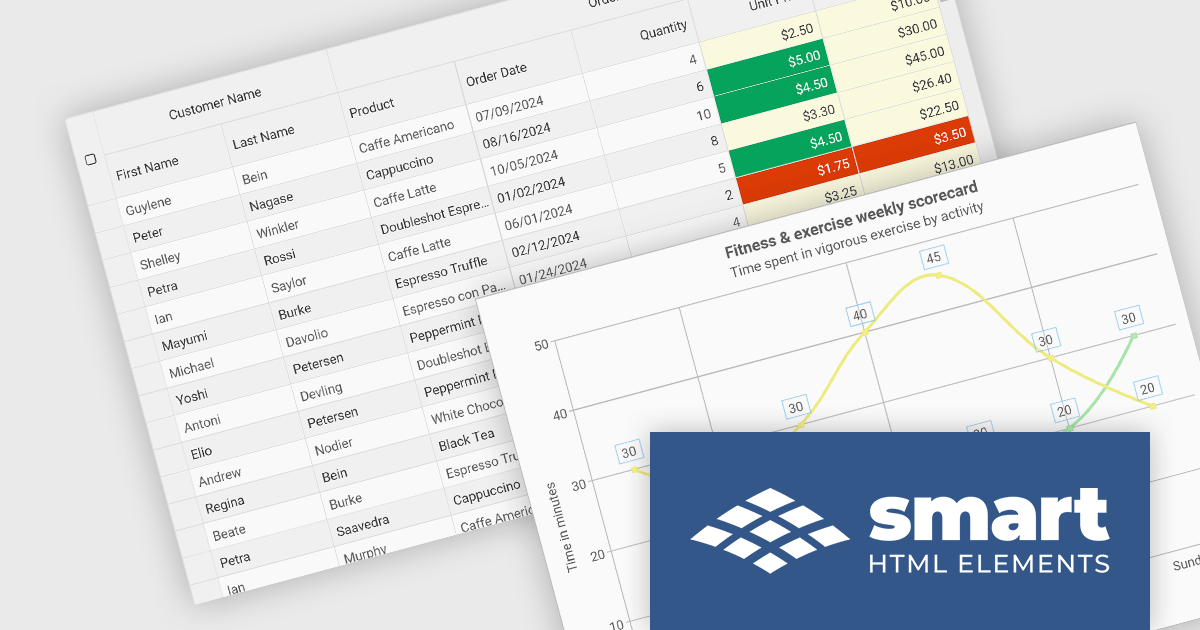
Smart HTML Elements is an enterprise-grade UI library offering pre-built web components for developers in Angular, React, Vue, Blazor, and JavaScript. It boasts over 60 ready-to-use components like grids, charts, schedulers, and editors, all featuring two-way data binding, responsiveness, accessibility, and theming capabilities. This library helps developers rapidly build dynamic and modern web applications with consistent look-and-feel and rich functionalities, accelerating development time and ensuring professional quality.
The Smart HTML Elements 19.1.0 release adds support for Angular 18, allowing developers to leverage the latest features and functionalities of Angular within their Smart HTML Elements components. Angular 18 introduces improvements in performance by tree-shaking unused code and better lazy loading, plus new features like standalone components and Angular templates in TypeScript.
To see a full list of what's new in 19.1.0, see our release notes.
Smart HTML Elements is licensed per developer and is available as a Perpetual license with 1 year support and maintenance. It includes distribution to Unlimited Web applications, SaaS projects, Intranets and Websites. See our Smart HTML Elements licensing page for full details.
Learn more on our Smart HTML Elements product page.
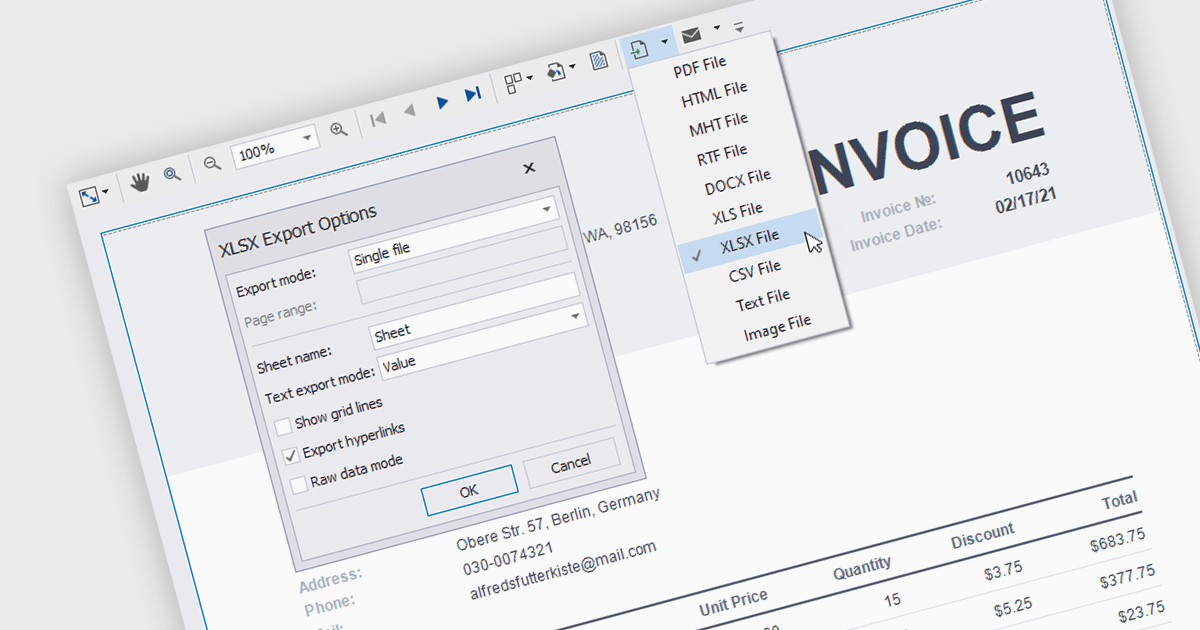
Reporting components with built-in XLS and XLSX export allow users to seamlessly generate Excel files directly from Angular web applications. This functionality empowers users to easily share and analyze report data in their preferred spreadsheet software, enhancing data accessibility and promoting informed decision-making. These components are particularly valuable for generating financial reports, sales data summaries, and other analytical exports.
Several Angular reporting components allow you to export reports to XLS or XLSX format:
For an in-depth analysis of features and price, visit our comparison of Angular reporting components.


Tel: (888) 850 9911
Fax: +1 770 250 6199


