


Fornitore ufficiale
In qualità di distributori ufficiali e autorizzati, forniamo licenze software legittime direttamente da più di 200 autori di software.
Vedi tutte le nostre marche
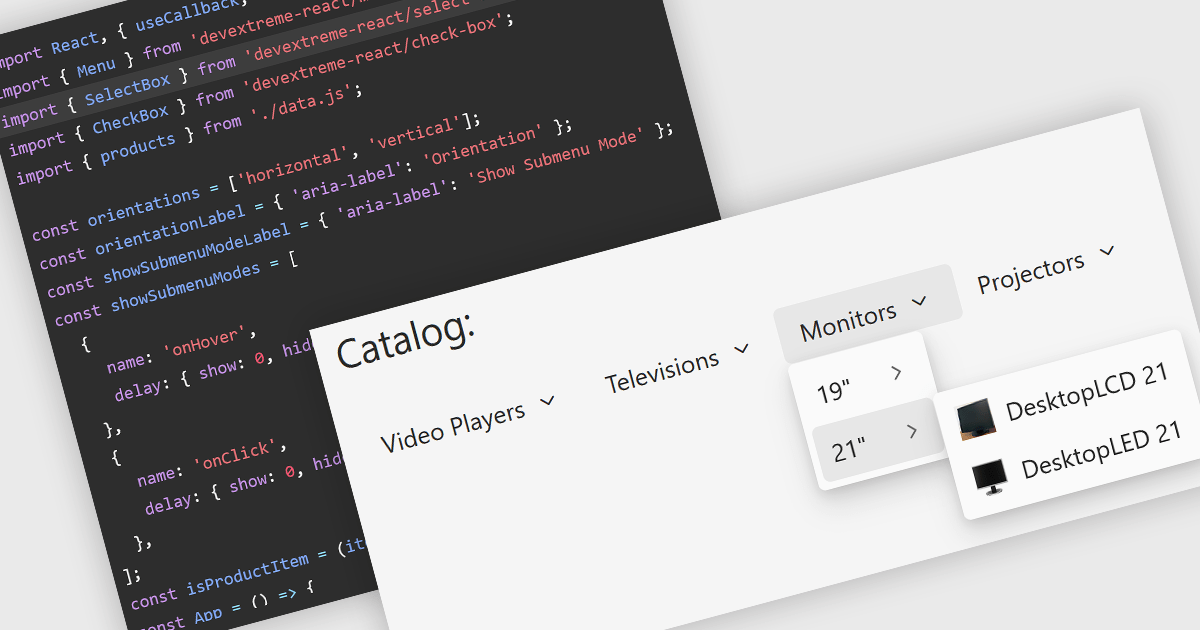
Menu components are a fundamental part of modern UI suites, providing structured navigation and quick access to commands, actions, and application features. They help developers create intuitive user experiences across desktop and web applications by supporting common interaction patterns such as context menus, navigation menus, toolbars, and hierarchical menu structures, while offering customization options to match application design and accessibility requirements.
Several React UI suites offer menu components including:
For an in-depth analysis of features and price, visit our React UI suite comparison.
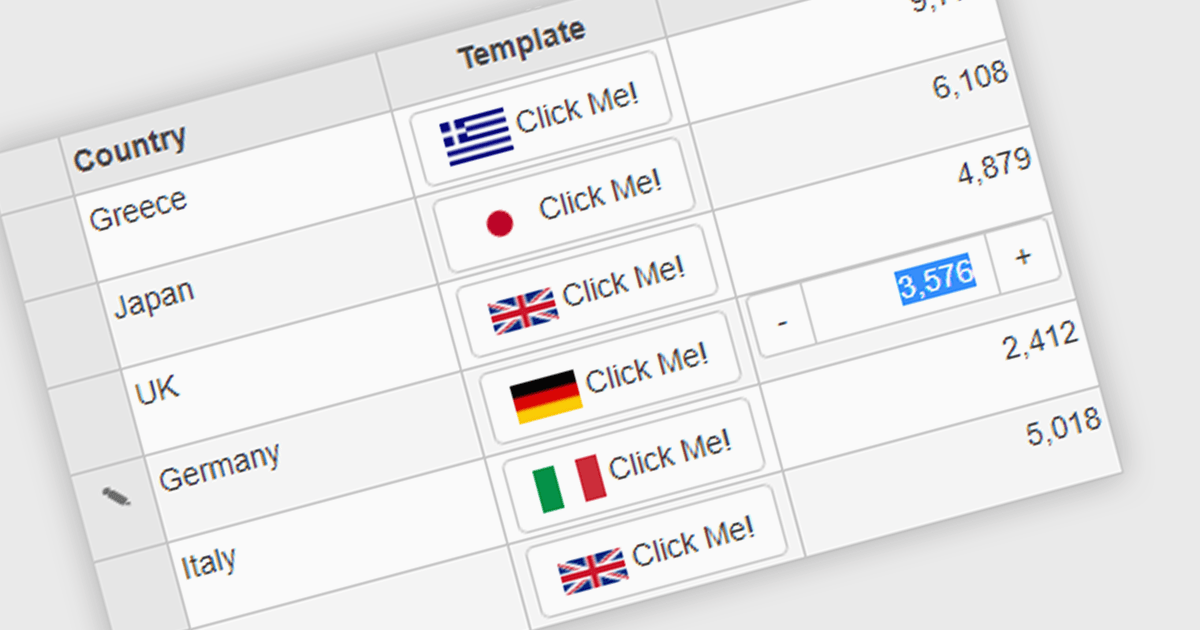
Button cell types allow developers to embed interactive buttons directly within grid cells, enabling users to perform actions such as editing, deleting, viewing details, launching dialogs, or executing custom commands without leaving the grid. By keeping actions closely associated with the relevant data, button cell types reduce unnecessary navigation, and improve usability. This makes them well suited to business applications such as customer relationship management systems, inventory management, financial dashboards, and administrative tools, where users frequently perform row-level actions on large datasets.
Several Angular grid controls offer support for button cell types, including:
For an in-depth analysis of features and price, visit our Angular Grid controls comparison.
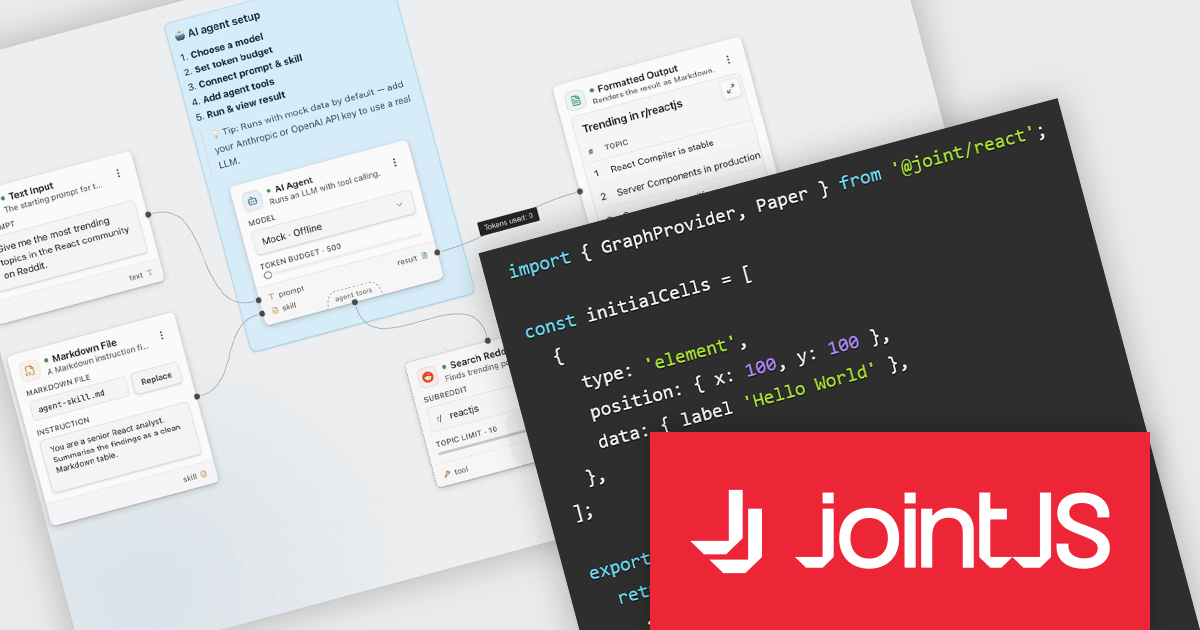
JointJS+ is a diagramming library that offers advanced features like custom shapes, data binding, and advanced layout algorithms, enabling you to create complex, interactive, and visually appealing diagrams. It includes a ready-to-use demo application that showcases its functionality and serves as a starting point for your own diagramming projects.
The JointJS+ v4.3.0 release introduces JointJS+ for React, giving React developers a more natural way to integrate advanced diagramming capabilities into their applications. By providing React-specific components and patterns, it aligns more closely with the React development model, reducing integration effort while making it easier to build, maintain, and extend diagramming features. This addition also helps development teams create more consistent user experiences within React applications, allowing them to take advantage of JointJS+ functionality without departing from established React workflows.
To see a full list of what's new in v4.3.0, see our release notes.
JointJS+ is licensed per developer and is available as a Perpetual license with 1 year support and maintenance. See our JointJS+ licensing page for full details.
Learn more on our JointJS+ product page.
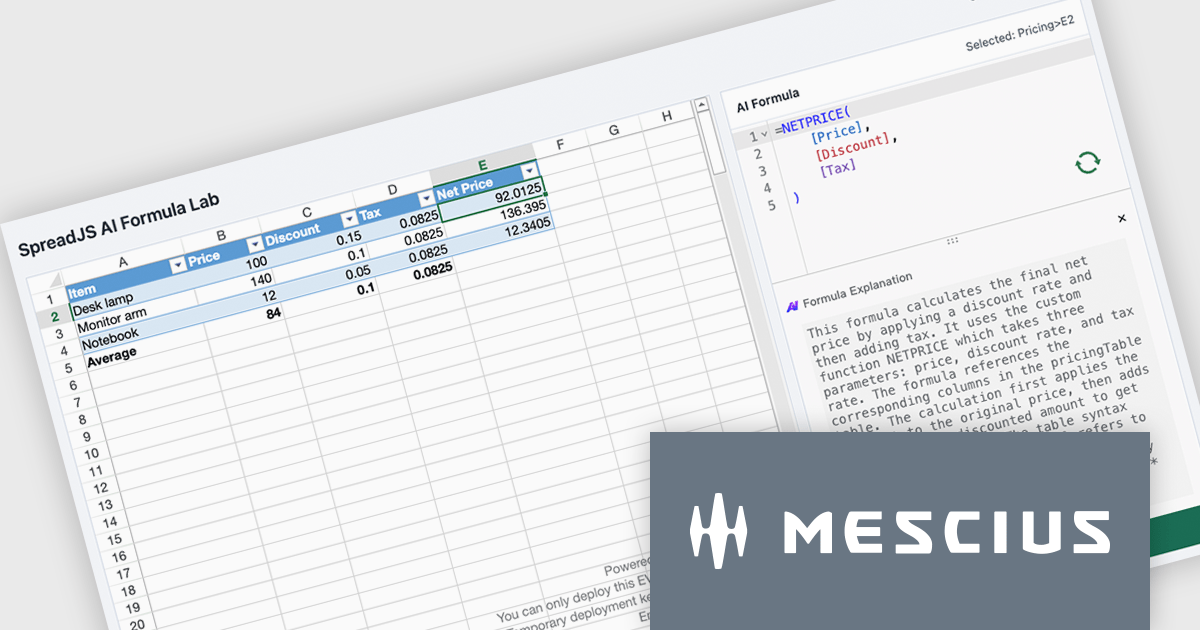
SpreadJS is a complete enterprise JavaScript spreadsheet solution used to create financial reports and dashboards, budgeting and forecasting models, scientific, engineering, healthcare, education, science lab notebooks, and other similar JavaScript business applications. It delivers true Excel-like spreadsheet experiences with zero dependencies on Excel, with full support for React, Vue, Angular, and TypeScript.
In this blog post, MESCIUS Product Manager Chris Bannon shows you how to connect the SpreadJS AI Assistance add-on to a custom-trained Ollama model so it can generate and explain application-specific spreadsheet formulas without requiring you to manually unpack every function, reference, and operator. Steps include:
Detailed code is included to help you along the way.
Read the complete blog and get started unlocking the power of the SpreadJS AI Assistant.
SpreadJS is licensed per developer and includes 1 Year Maintenance (major and minor version releases and unlimited support phone calls). SpreadJS requires an Annual or Perpetual Deployment License. The optional Add-ons are available at an additional cost, and require a SpreadJS license. See our SpreadJS licensing page for full details.
For more information, visit our SpreadJS product page.
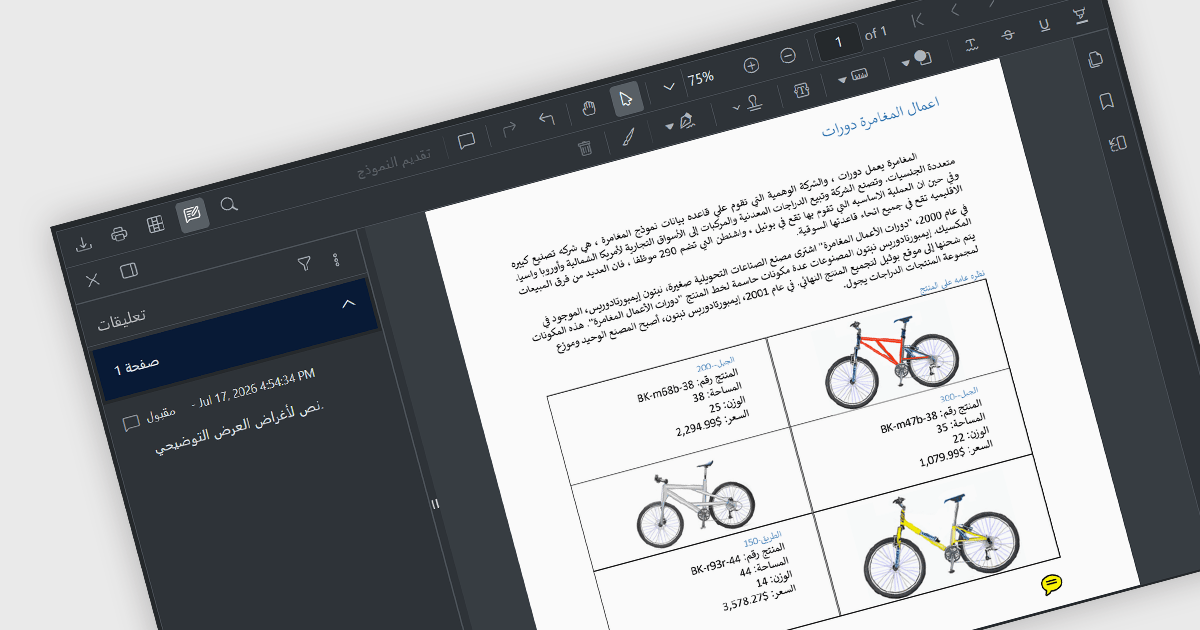
Right-to-left (RTL) support in a PDF viewer enables the interface and document navigation to align with languages that are read from right to left, such as Arabic, Hebrew, Persian, and Urdu. In a PDF context, RTL support typically adjusts the viewer's layout, navigation controls, scrolling behavior, and text interaction to provide a reading experience that matches the conventions of RTL languages. This improves usability, accessibility, and user familiarity for RTL audiences while helping applications deliver a more localized and consistent user experience.
Several JavaScript PDF viewer components include RTL support, such as:
For an in-depth analysis of features and price, visit our comparison of JavaScript PDF viewer components.


Tel: (888) 850 9911
Fax: +1 770 250 6199


