


Fornitore ufficiale
In qualità di distributori ufficiali e autorizzati, forniamo licenze software legittime direttamente da più di 200 autori di software.
Vedi tutte le nostre marche

SmartClient is a comprehensive JavaScript component suite compatible with React, Vue, Angular, and more, that empowers you to craft large-scale, high-productivity Enterprise web applications. Its modern class system fosters clean encapsulation of application modules and screens, resulting in a more maintainable and comprehensible codebase.
In this blog post, Alex Fashakin demonstrates how to use SmartClient's built-in feature to save search preferences on grids. Steps include:
Read the complete blog to learn how to boost productivity with the SmartClient saved search feature.
For more information visit our SmartClient product page.
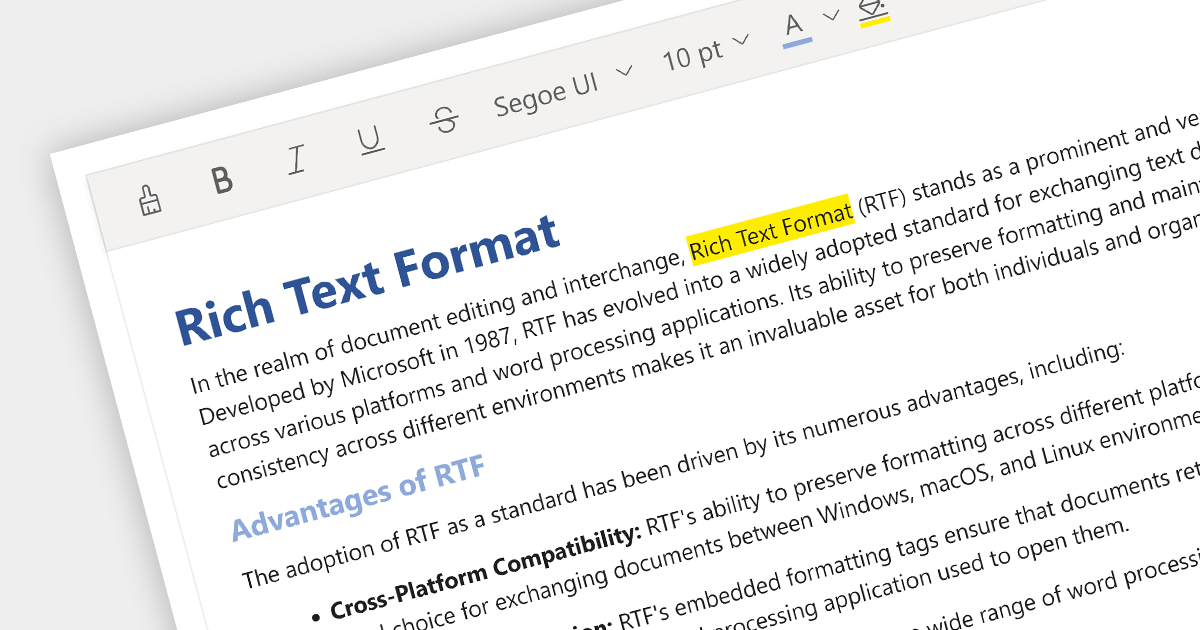
Rich Text Format (RTF) editors allow users to create and edit text with a variety of formatting options, such as font styles, colors, headings, lists, and images. Often used in web and desktop applications, such editors provide a WYSIWYG (what you see is what you get) interface, so users can see how their text will look as they format it. This allows formatted editing without the complexity of HTML markup or the need for separate word processing software.
Several Angular data editor collections provide RTF editing capabilities including:
For an in-depth analysis of features and price, visit our comparison of Angular Data Editor components.
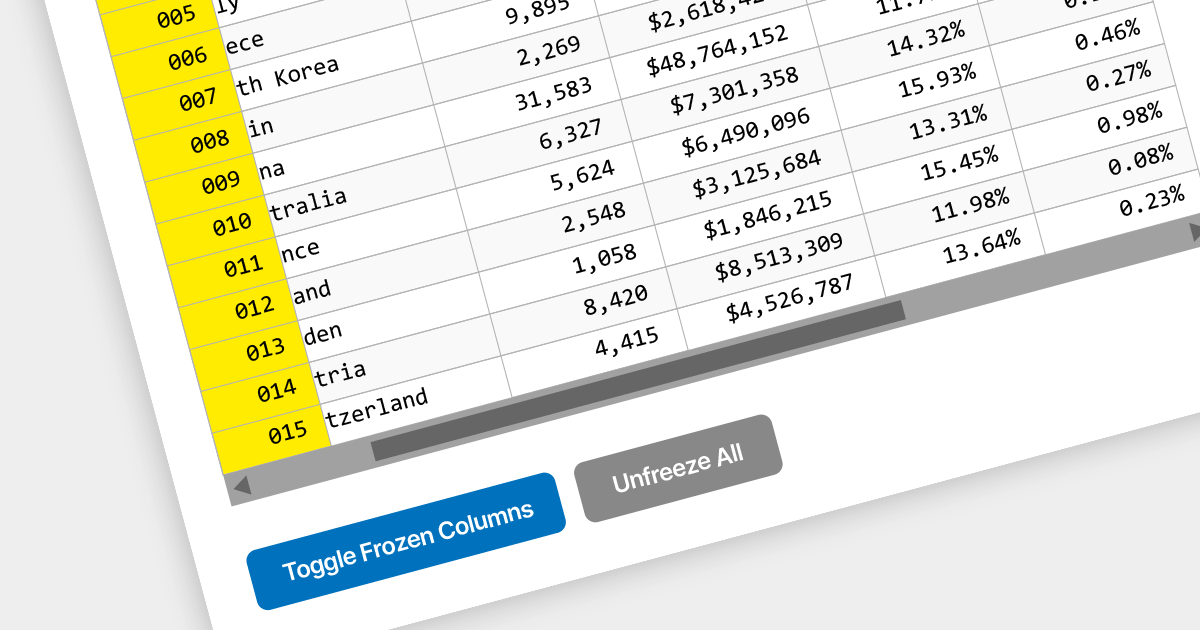
Locked column functionality (also known as frozen or pinned column) allows users to keep one or more columns static while scrolling horizontally through a grid. This is an essential feature for comparing data across a wide grid, ensuring that key information, such as a row identifier column, remains in view.
Several React grid components offer column freezing functionality including:
For an in-depth analysis of features and price, visit our comparison of React Grid components.
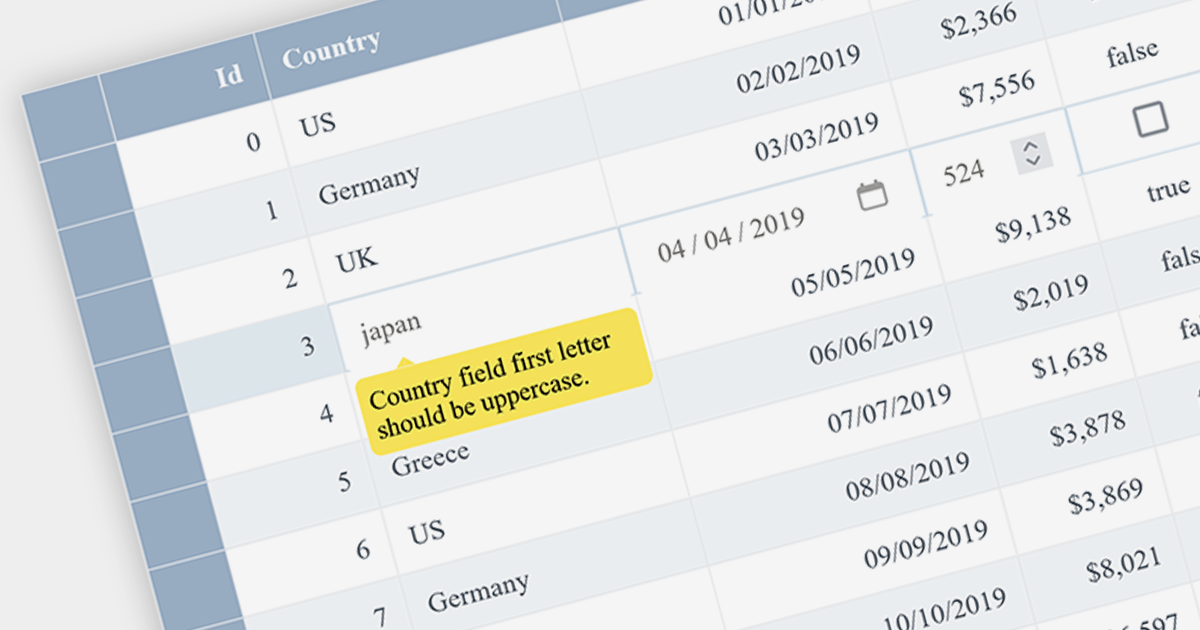
Data Validation ensures that input data meets certain criteria before it is accepted. This feature is crucial for maintaining data integrity and preventing user errors. For example, a grid might only allow date formats in a specific cell or prevent duplicate entries in a column, thereby enforcing data consistency.
Several Angular grid controls offer data validation support including:
Alternatively, many Angular grid controls are available as part of multi-function suites:
For an in-depth analysis of features and price, visit our comparison of Angular grids.

Infragistics Ignite UI for Angular is a comprehensive library of Angular-native UI controls and Material-based UI components, which includes a high-performance data grid and over 60 charts. Its WYSIWYG app builder helps you streamline your development process and deliver cutting-edge Angular solutions in a fraction of the time.
The 23.1 (17.0.0) release adds support for Angular 17, which offers enhanced performance through deferrable views, more intuitive syntax with built-in control flow, and accelerated builds for hybrid and client-side rendering.
To see a full list of what's new in version 23.1 (17.0.0), see our release notes.
For more information, visit our Infragistics Ignite UI for Angular product page.


Tel: (888) 850 9911
Fax: +1 770 250 6199


