Fornitore ufficiale
In qualità di distributori ufficiali e autorizzati, forniamo licenze software legittime direttamente da più di 200 autori di software.
Vedi tutte le nostre marche
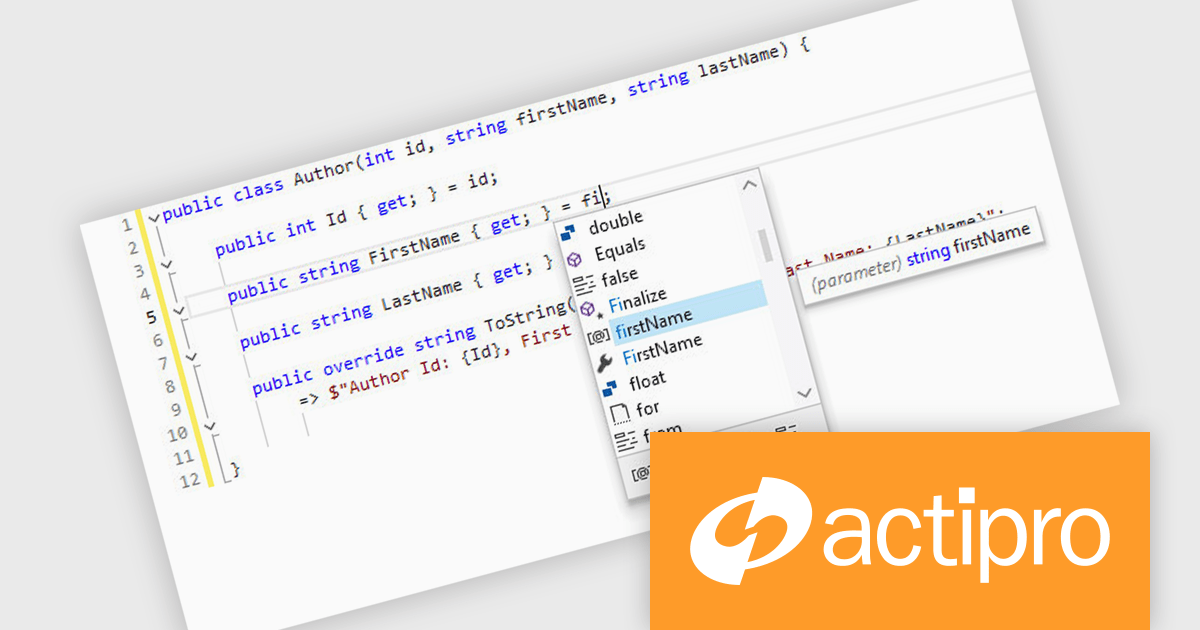
Actipro SyntaxEditor is a sophisticated WPF code editor control designed to provide developers with a seamless way to integrate advanced code editing capabilities into their .NET applications. It offers syntax highlighting for numerous programming languages, code outlining, automated IntelliPrompt (code completion and information tooltips), background parsing, error reporting, and more. This delivers a familiar user experience for developers used to the powerful code editors found in popular IDEs.
The Actipro SyntaxEditor v25.1 update improves the .NET Languages Add-on with full support for C# 13, ensuring every new language construct is parsed correctly and presented accurately in the editor. By incorporating raw string literals, file-scoped namespaces, list patterns, required members and parameter null checking, it allows IntelliSense to provide precise code completions and signature help for the latest API surface. Real-time error detection flags invalid C# 13 syntax, reducing the feedback loop between editing and compilation. Refactoring operations such as renaming, extraction and code generation now understand modern construct semantics to preserve code integrity without manual intervention. This makes it simpler to adopt the most recent C# advancements within any WPF-based IDE or editor.
To see a full list of what's new, see our Actipro SyntaxEditor for WPF release notes.
Actipro SyntaxEditor is licensed per developer and is available as a Perpetual license with 1 year support and maintenance. See our Actipro SyntaxEditor for WPF licensing page for full details.
Actipro SyntaxEditor for WPF is available individually, or as part of Actipro WPF Studio.
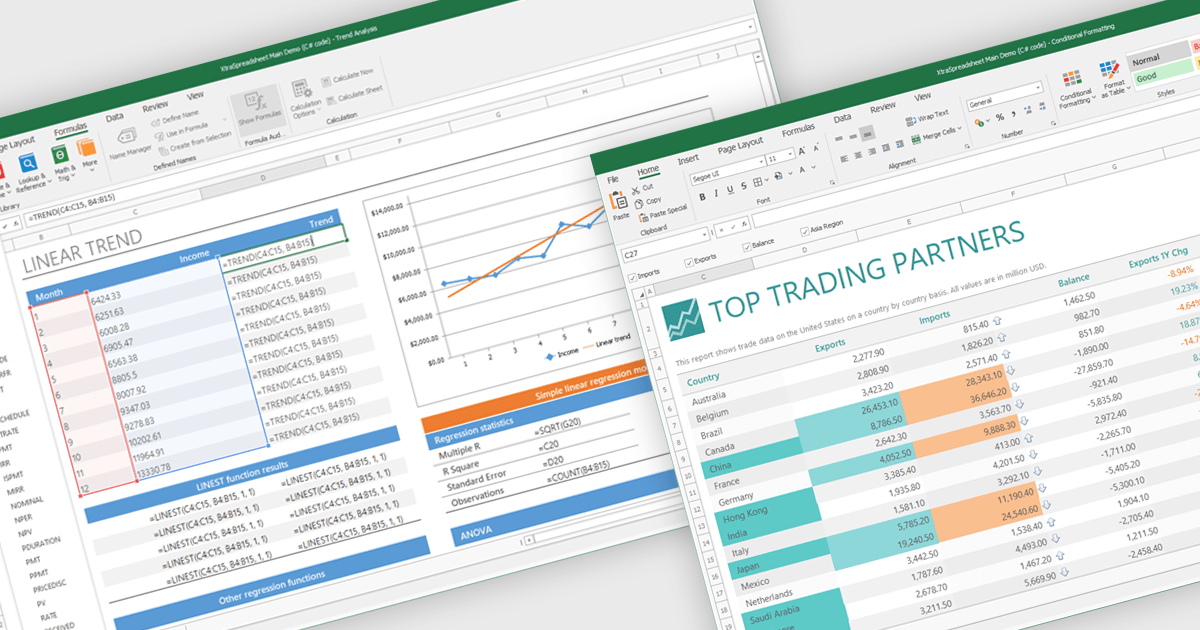
Chart support in a spreadsheet component refers to the ability to create, render, and manipulate various types of charts - such as line, bar, pie, and area charts - all within the spreadsheet environment. This functionality allows spreadsheet developers to present data visually and dynamically, without needing to rely on external charting libraries. The integration of charting capabilities enhances the end-user experience by making complex data more understandable. For developers, this reduces the need for separate visualization components, improves performance through tighter integration, and simplifies the deployment of data-centric applications.
Several .NET Winforms spreadsheet controls offer chart support, including:
For an in-depth analysis of features and price, visit our .NET Winforms spreadsheet controls comparison.
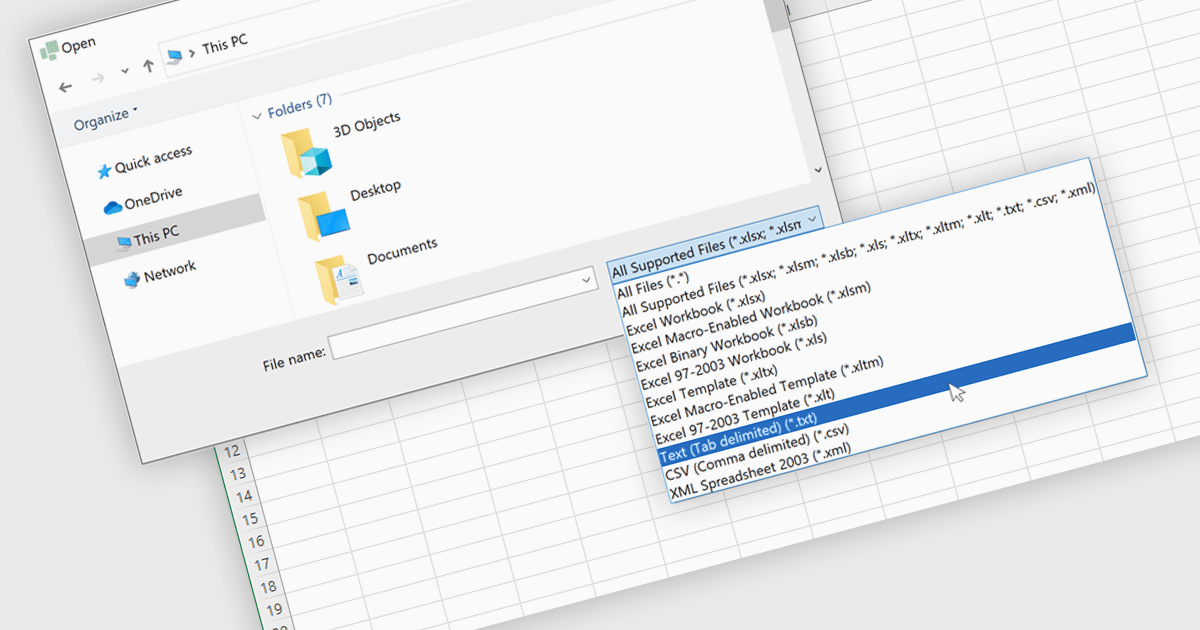
Importing TXT files into spreadsheet applications allows developers and users to load in plain text data, typically delimited by characters such as commas or tabs, and transform it into structured, editable tables within a spreadsheet-like environment. This process enables users to work with externally sourced or manually created text data using the familiar tools and features of a spreadsheet, such as sorting, filtering, and formula calculations. Loading a text file into an Excel-like format removes the need for manual data entry and simplifies data processing. Support for TXT file imports makes spreadsheet applications more versatile by improving the integration of external data and helping users process information more efficiently. It reduces the workload associated with data processing and ensures that data is quickly available in a usable format for analysis or reporting.
Several WinForms spreadsheet controls allow you to import files in TXT format:
For an in-depth analysis of features and price, visit our comparison of WinForms spreadsheet controls.
XFINIUM.PDF is a comprehensive software library designed to empower developers with robust tools for integrating PDF functionalities into their applications across a wide range of platforms. This library enables the creation, editing, and manipulation of PDF documents with a single codebase. This cross-platform approach eliminates the need for platform-specific development, significantly reducing development time and effort while ensuring consistency in functionality and user experience across devices. Ideal for applications that require advanced document workflows, digital signatures, form handling, or PDF generation, XFINIUM.PDF offers a solution for businesses and developers seeking to deliver PDF capabilities across diverse environments.
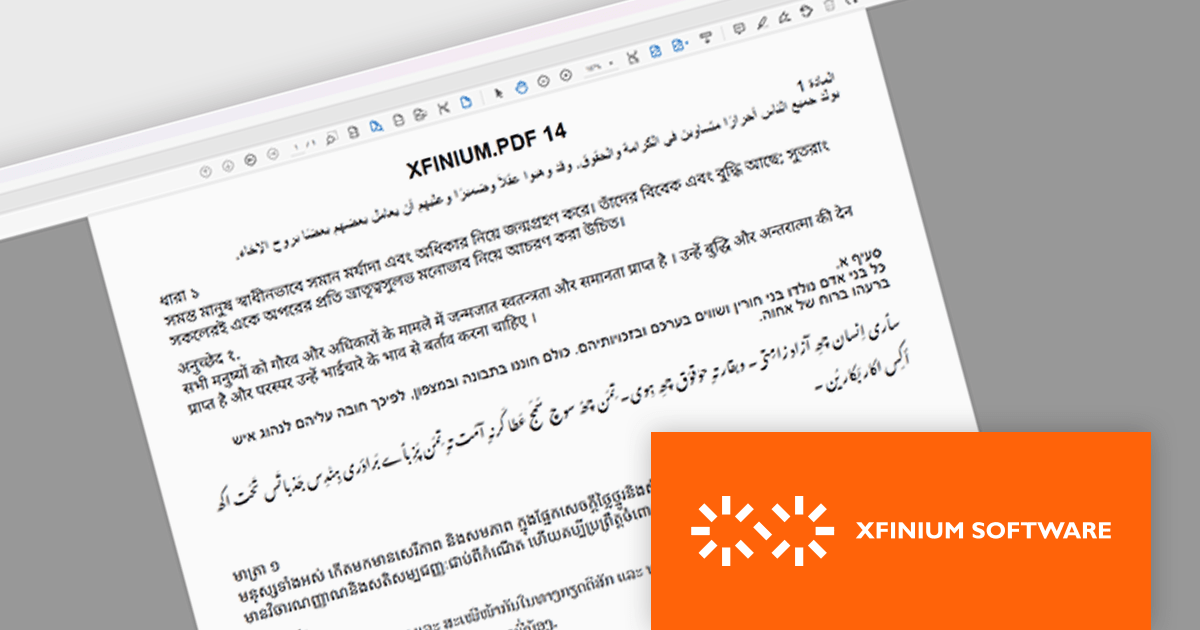
The latest version of XFINIUM.PDF significantly expands its text rendering capabilities by introducing support for complex scripts. This enhancement enables accurate representation of right-to-left and context-sensitive scripts such as Arabic, Hebrew, and more intricate Indic scripts including Bengali, Devanagari, Tamil, Thai, and Khmer. By incorporating these languages, XFINIUM.PDF now offers developers a more versatile and globally inclusive PDF generation toolkit, making it an excellent choice for applications requiring multilingual support and precise typographic control in diverse linguistic contexts.
XFINIUM.PDF is licensed per developer and is run-time royalty free. All licenses include a 12 month subscription which provides all major and minor product updates and technical support. See our XFINIUM.PDF licensing page for full details.
XFINIUM.PDF is available to buy in the following products:
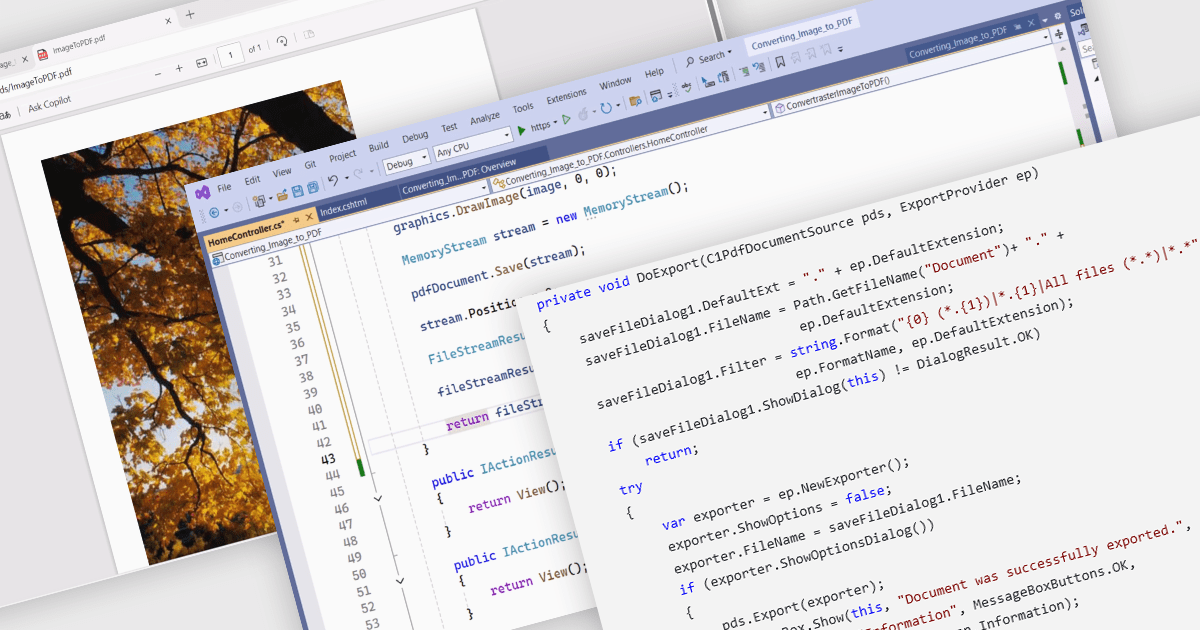
PDF conversion capabilities are a core feature of many PDF components, enabling interoperability between different document formats. These tools are essential where content needs to be shared, archived, or presented in a consistent and platform-independent way. Whether integrating into enterprise applications or powering document automation solutions, PDF conversion features allow developers to manipulate and repurpose content while preserving layout fidelity and document integrity across varied formats.
Common features include:
For an in-depth analysis of features and price, visit our WinForms PDF components comparison.