


Fornitore ufficiale
In qualità di distributori ufficiali e autorizzati, forniamo licenze software legittime direttamente da più di 200 autori di software.
Vedi tutte le nostre marche
Telerik Reporting and Telerik Report Server deliver a complete solution for creating, managing, and distributing reports across .NET applications. Telerik Reporting is a lightweight, embedded reporting tool for .NET web and desktop apps. It lets developers and users easily design, customize, and export interactive, reusable reports. It supports multiple platforms, including ASP.NET Core, Blazor, MVC, AJAX, HTML5/JS, Angular, WPF, WinForms, and WinUI. Telerik Report Server is a web-based, server-side solution for centralized report management. Built on Telerik Reporting, it offers scheduling, delivery, user management, and web-based access. It can be used standalone or integrated into apps built with Blazor, Angular, or Windows Forms.
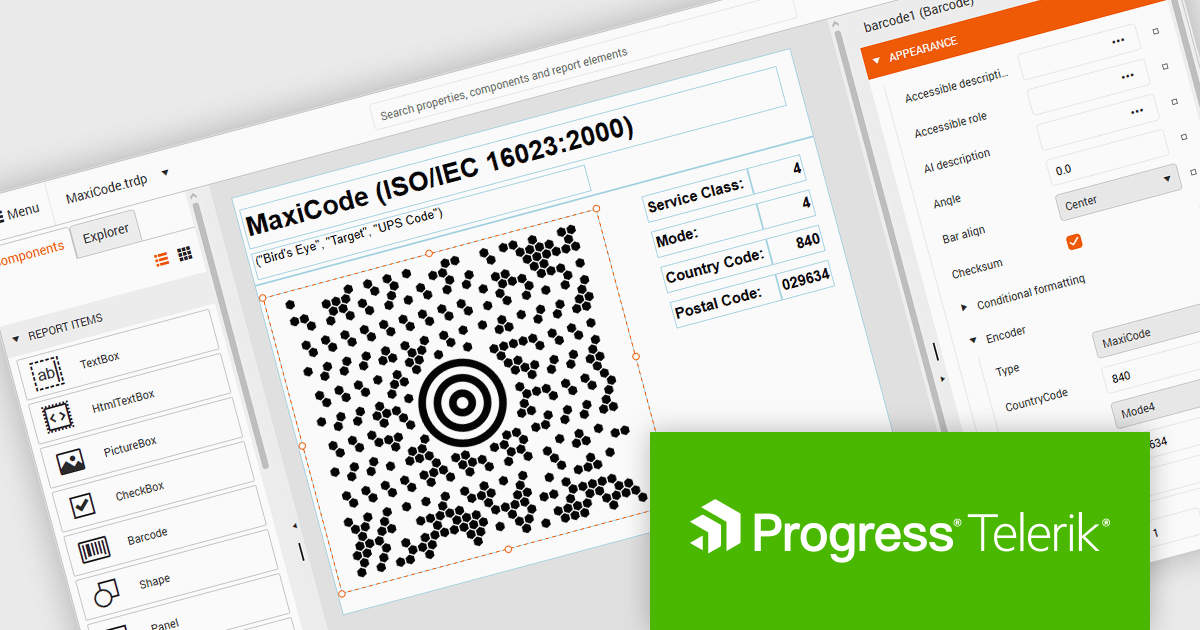
The Telerik Reporting and Report Server 2026 Q2 update adds MaxiCode barcode support, enabling developers to generate UPS-compatible shipping labels directly within Telerik reporting workflows without relying on separate labeling tools. The enhancement ensures accurate MaxiCode rendering across export formats including PDF, HTML, DOCX, XAML, Image, and RTF, while allowing barcode generation, scheduling, distribution, and reporting to be managed from a single platform. This helps organizations streamline shipping and fulfillment processes, automate high-volume delivery workflows through scheduled reports and data alerts, and reduce operational complexity.
To see a full list of what's new, see our release notes for Telerik Reporting and Telerik Report Server 2026 Q2.
Telerik Reporting is licensed per developer and is available as an Annual Subscription License, which includes product updates, technical support, AI Productivity Tools, and other benefits for 12 months. Telerik Report Server is licensed per domain, with each license including 15 Client Access Licenses (CALs) and 12 months of support and maintenance. See our licensing pages for full details. See our licensing pages for Telerik Reporting and Telerik Report Server for full details.
Telerik Reporting and Telerik Report Server are available individually or as part of Telerik DevCraft Ultimate.
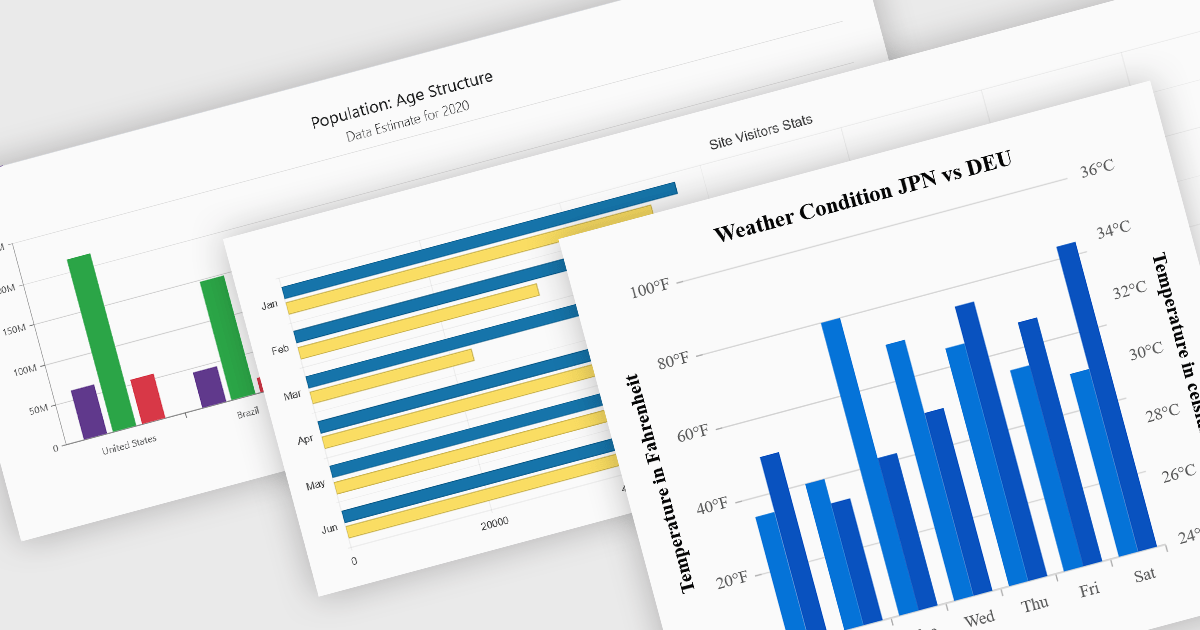
Column and bar charts are among the most widely used data visualization features in modern charting components, helping developers present comparisons, trends, and category-based metrics in a format that is easy to interpret. By displaying values as horizontal or vertical bars, these chart types allow applications to communicate changes in performance, rankings, distributions, and other business data with clarity. Modern charting components typically support customization options such as stacked series, grouped categories, animations, tooltips, responsive layouts, and interactive behaviors, enabling developers to create dashboards and reporting experiences that suit a wide range of enterprise and analytical scenarios.
Several Blazor chart controls offer column and bar charts including:
For an in-depth analysis of features and price, visit our Blazor chart controls comparison.
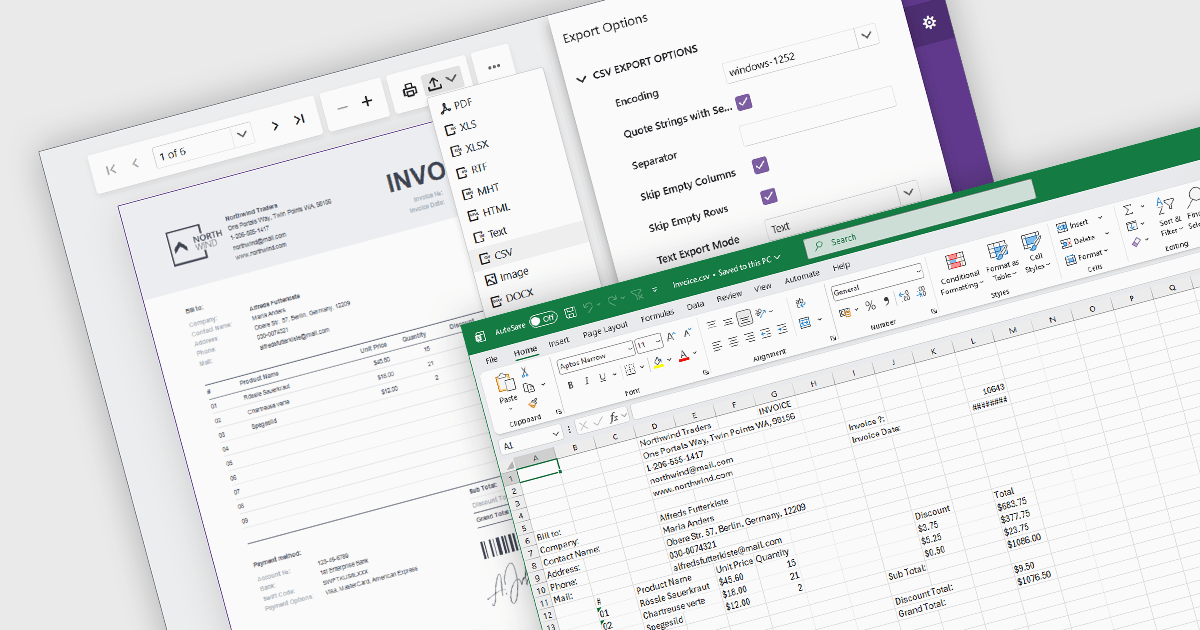
Exporting reports to CSV (Comma-Separated Values) format provides a simple and widely compatible way to transfer report data into spreadsheet applications, databases, analytics platforms, and other business systems. CSV files store structured data as plain text, making them easy to process, automate, archive, and exchange across different environments. For software developers and business users, CSV export functionality supports data analysis, operational reporting, integration workflows, and data retention requirements while maintaining low file complexity and broad platform support.
Several Blazor reporting components allow you to export to CSV, including:
For an in-depth analysis of features and price, visit our comparison of Blazor reporting components.
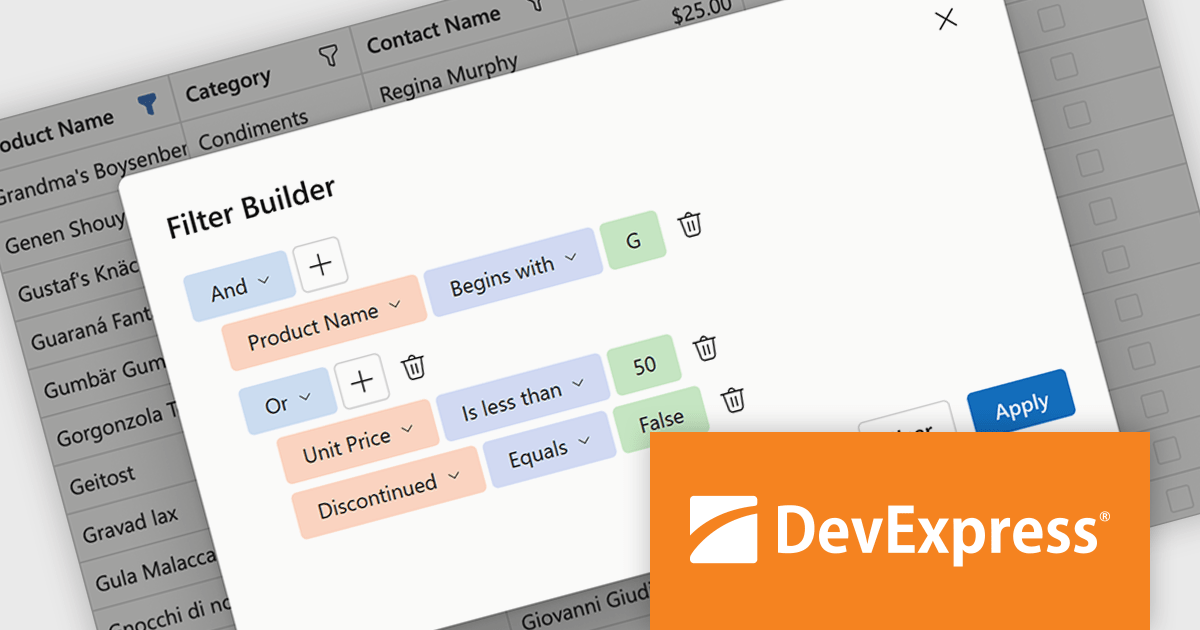
DevExpress Blazor (part of DevExpress ASP.NET and Blazor) helps you create high-impact user experiences for both Blazor Server and Blazor WebAssembly using C#. The Blazor UI Component Library ships with a comprehensive set of native components including a Grid, Pivot Table, Scheduler, Chart, Data Editors and Reporting.
DevExpress Blazor now includes an integrated Filter Builder for its Grid and TreeList components, making it easier for users to define advanced filtering criteria through a visual interface. Filter Builder fields are generated automatically from existing data columns, so developers can add sophisticated filtering capabilities without extra configuration or custom implementation work. This approach helps users work with large datasets more efficiently while maintaining a consistent experience across Blazor applications.
DevExpress ASP.NET and Blazor is licensed per developer and is available as a Perpetual License with a 12 month support and maintenance subscription. See our DevExpress ASP.NET and Blazor licensing page for full details.
DevExpress Blazor is available in the following products:
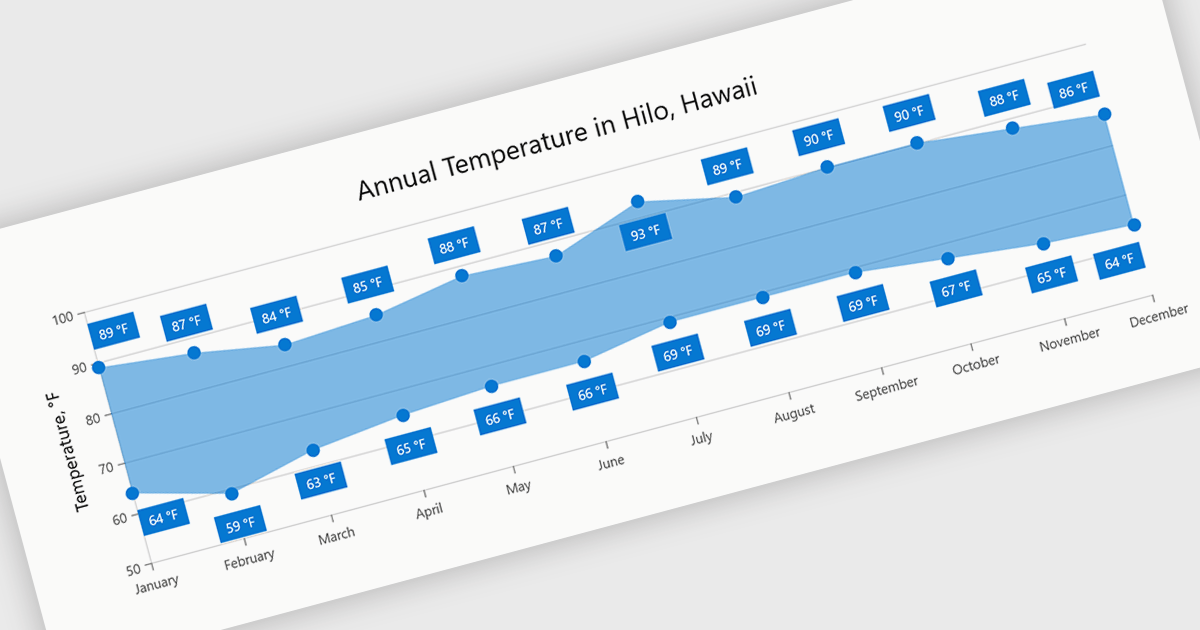
Range charts visualize the difference between minimum and maximum values for each data point using a filled area to represent variation. This makes it easier to understand fluctuations, compare ranges and identify patterns without the clutter of multiple lines. By focusing on value distribution rather than individual points, they improve readability and highlight trends and inconsistencies at a glance. They are useful for scenarios such as tracking temperature ranges, monitoring performance thresholds or comparing variations across datasets.
Several .NET Blazor charting components provide you with range charts, including:
For an in-depth analysis of features and price, visit our .NET Blazor chart controls comparison.


Tel: (888) 850 9911
Fax: +1 770 250 6199


