








Fornitore ufficiale
In qualità di distributori ufficiali e autorizzati, forniamo licenze software legittime direttamente da più di 200 autori di software.
Vedi tutte le nostre marche
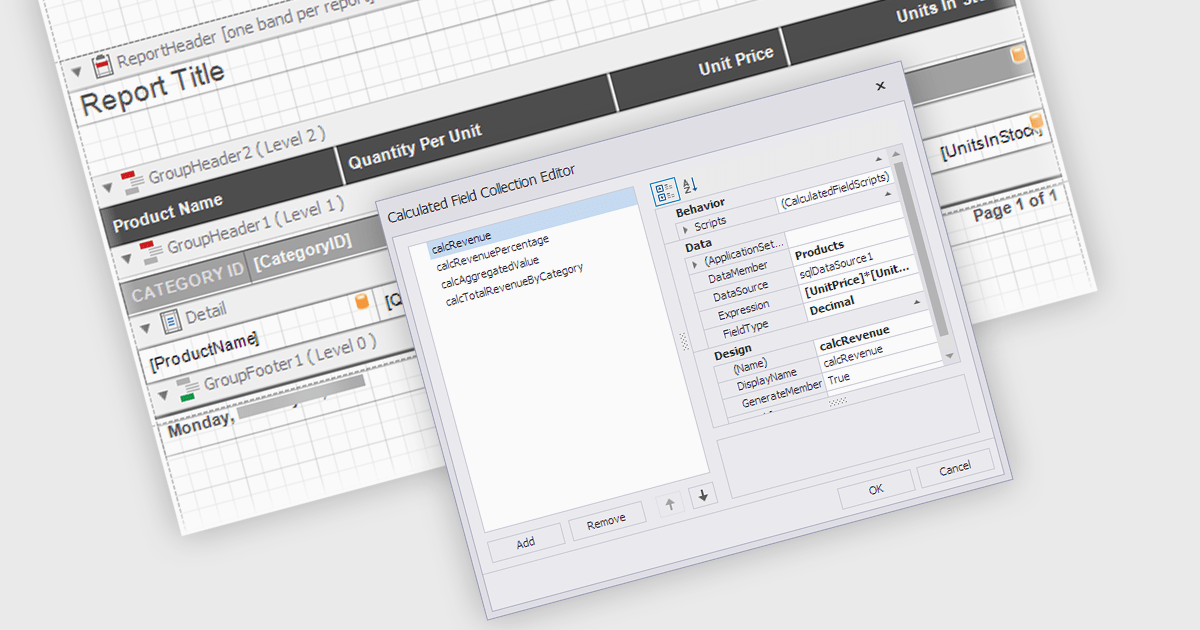
Calculated Fields in .NET WPF Reporting controls enable developers to dynamically compute values based on data from the report's dataset. These fields are not part of the original data source but are created by applying expressions, functions, or formulas to existing data. By leveraging calculated fields, developers can customize reports with real-time data manipulation, allowing for more sophisticated analysis and presentation without altering the underlying data model. The key benefits include reducing the need for external data processing, improving performance by handling computations within the report, and offering more flexibility in how data is displayed and interpreted.
Several .NET WPF reporting controls offer calculated field functionality including:
For an in-depth analysis of features and price, visit our comparison of .NET WPF Reporting controls.
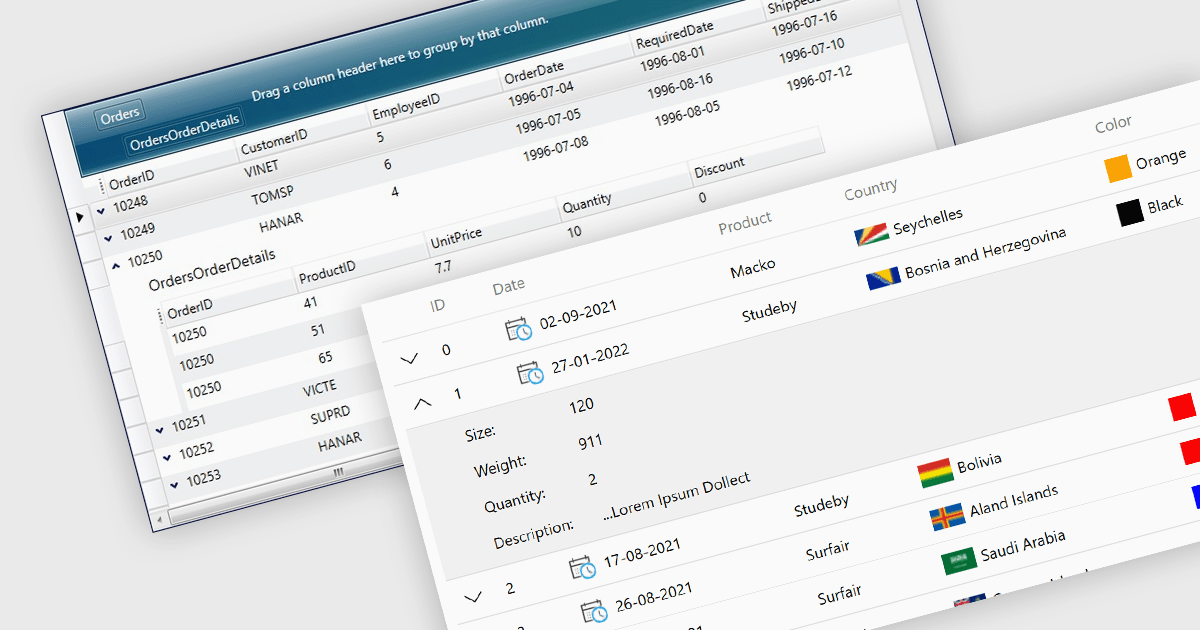
Master-detail is a user interface design technique where a primary data set (the master) is displayed in a grid format, and related information (the detail) is typically shown in an adjacent pane when a master item is selected. The resulting hierarchical structure allows users to efficiently navigate and explore complex data sets by viewing high-level information in the master grid while accessing more granular details on demand, without navigating away from the main page. The master-detail view enhances the user experience as it improves the organization of the grid and streamlines workflows as users can quickly switch between records and details.
Several .NET 8 WPF grid components offer support for master-detail, including:
For an in-depth analysis of features and price, visit our comparison of .NET 8 WPF grid components.
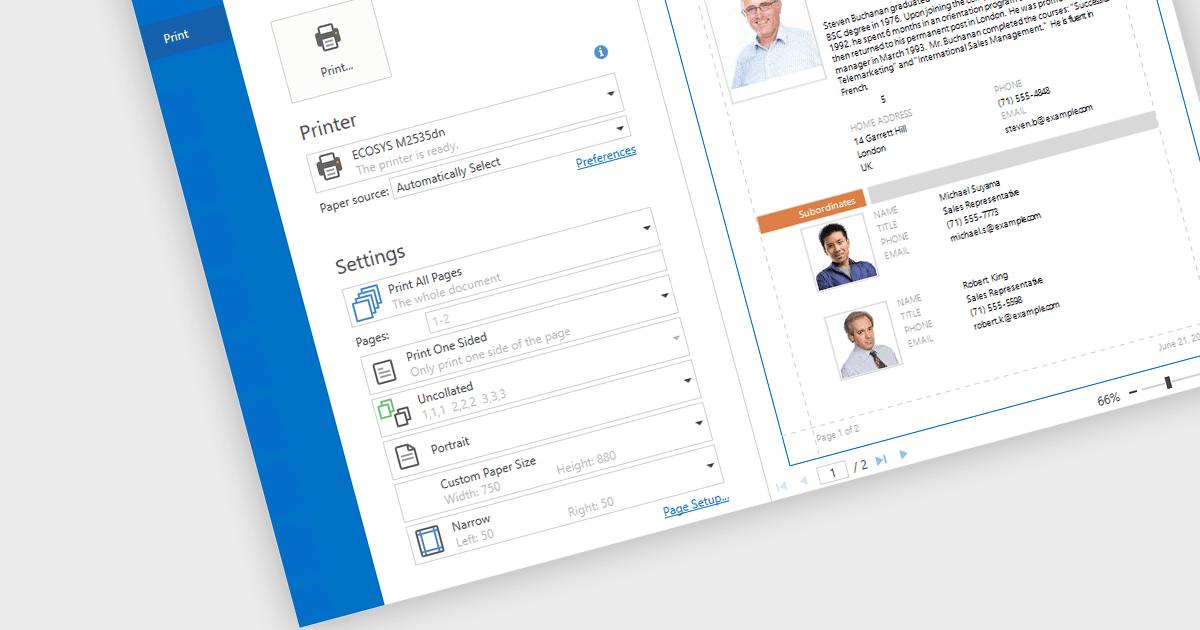
Print & Preview .NET WPF controls provide a comprehensive solution for printing and previewing content within your WPF applications. These controls offer a user-friendly interface for users to review their content before committing to printing, ensuring accuracy and preventing costly errors. Additionally, they support various printing options, including page orientation, margins, and scaling, allowing developers to customize the printing experience to meet specific requirements.
Many .NET WPF UI Suites contain Print & Preview controls including:
For an in-depth analysis of features and price, visit our comparison of .NET WPF UI Suites.
Telerik UI for WPF is an extensive UI library specifically designed for building modern and feature-rich business applications using the Windows Presentation Foundation (WPF) framework. It offers many customizable controls, ranging from data-driven grids and charts to specialized navigation and input components. The suite emphasizes performance and user experience, providing data virtualization for handling large datasets efficiently and ensuring visually appealing interactions.
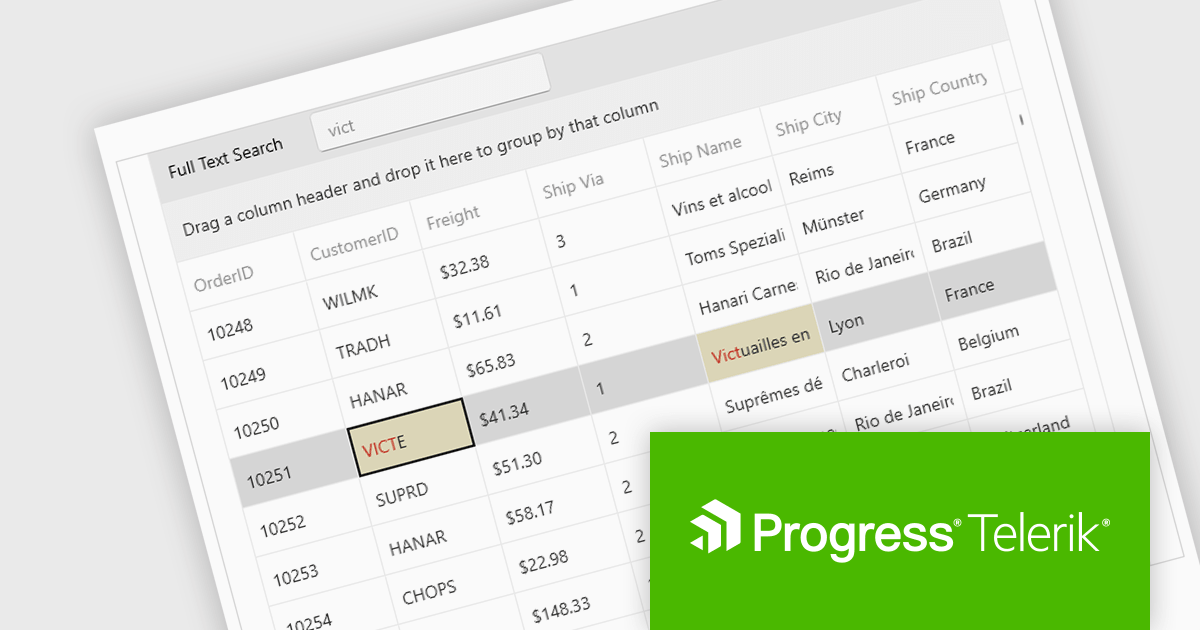
The Telerik UI for WPF 2024 Q3 (2024.3.806) update enhances the DataGrid control by implementing "Search as You Type" behavior without filtering the items. This new option provides users with greater control over the grid search process with the ability to disable data filtering when performing search operations. By enabling users to tailor the filtering behavior, this feature ensures that search results are not inadvertently limited by active filters, potentially revealing more relevant data that would otherwise be hidden.
To see a full list of what's new in 2024 Q3, see our release notes.
Telerik UI for WPF is licensed per developer and is available as a perpetual license with a one year support subscription, which is available in three tiers: Lite, Priority or Ultimate. See our Telerik UI for WPF licensing page for full details.
Telerik UI for WPF is available to buy in the following products:
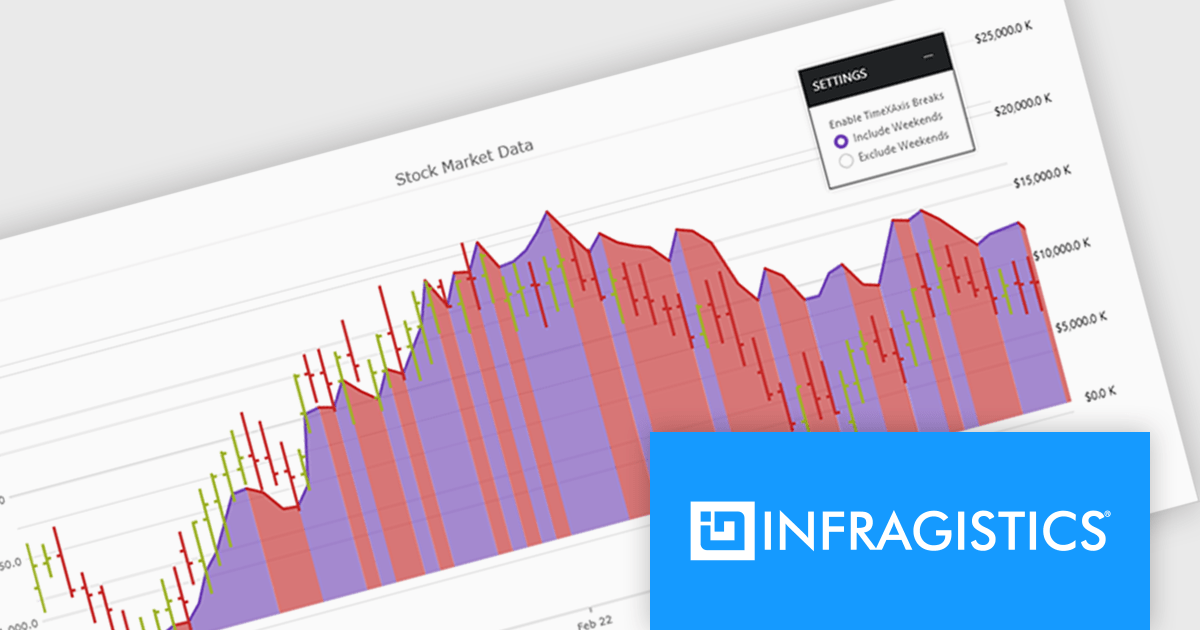
Infragistics Ultimate UI for WPF is a comprehensive suite of UI controls designed to streamline development and enhance the user experience of desktop applications. Boasting over 100 components, it offers a rich set of functionalities, including data visualization tools, high-performance grids, and modern UI elements that mimic the look and feel of Microsoft Office. These feature-packed libraries empower developers to craft powerful, visually appealing applications with a consistent user experience.
The Infragistics Ultimate UI for WPF 24.1 release offers enhanced chart interactivity with the new series selection feature. Applicable to category, financial, and radial charts, this feature allows users to select individual series and visually differentiate them using color changes or adding focus outlines. Developers have granular control over selection behavior, choosing to affect entire series or specific data items, and can manage multiple selections simultaneously. This functionality proves invaluable for highlighting data patterns and trends, facilitating comparisons between data points.
To see a full list of what's new in 24.1, see our release notes for Infragistics Ultimate UI for WPF.
Infragistics Ultimate UI for WPF is licensed per developer and is available as a Perpetual License with 1, 2 or 3 year support and maintenance subscription. See our Infragistics Ultimate UI for WPF licensing page for full details.
Infragistics Ultimate UI for WPF is available to buy in the following products:





Tel: (888) 850 9911
Fax: +1 770 250 6199


