


Fornitore ufficiale
In qualità di distributori ufficiali e autorizzati, forniamo licenze software legittime direttamente da più di 200 autori di software.
Vedi tutte le nostre marche
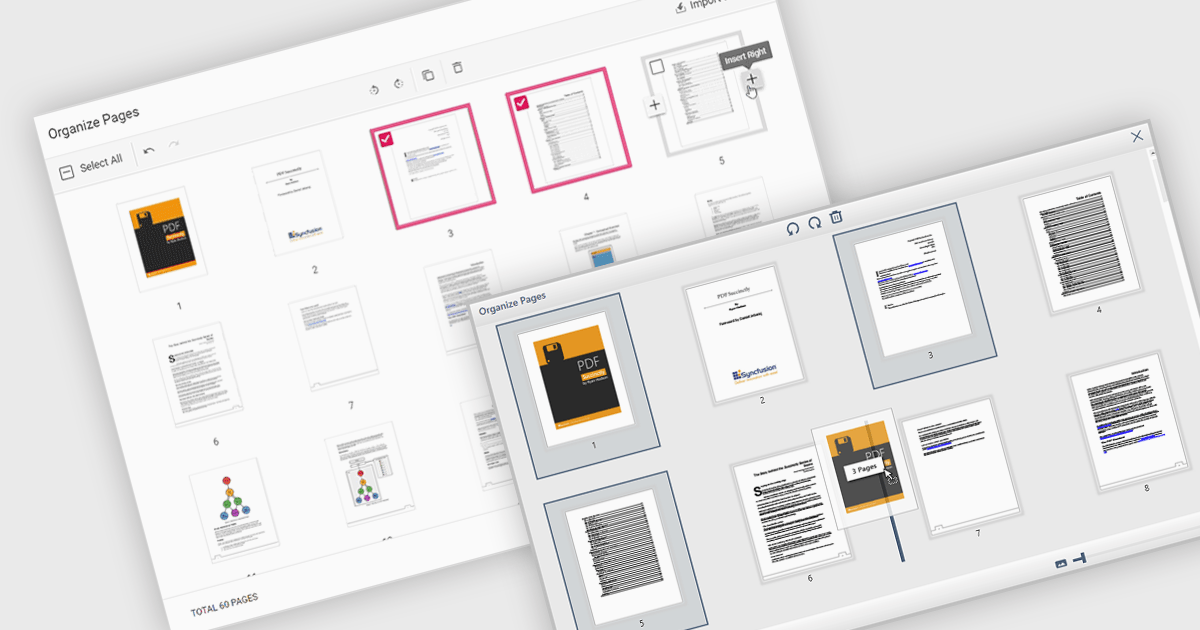
Moving pages in a PDF file refers to the ability to change the order of individual pages within the document. This is typically done by dragging and dropping pages into a new sequence or by specifying where a page should be relocated. The main benefit of this feature is improved document organization, especially in cases where content needs to be restructured for clarity, relevance, or compliance with formatting requirements. It also simplifies tasks such as compiling reports, merging multiple sources, or preparing documents for printing and distribution, making it easier to manage large or complex PDF files efficiently.
Several WPF PDF components allow you to move pages in a PDF, including:
For an in-depth analysis of features and price, visit our comparison of WPF PDF components.
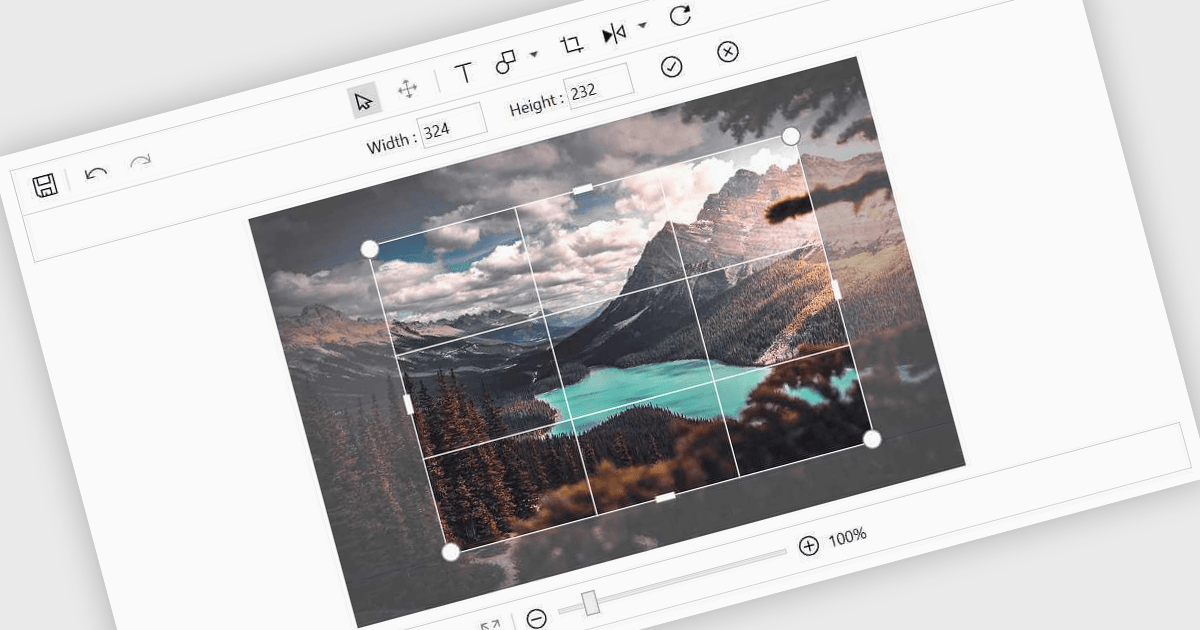
Image editing in a data editor component helps users work with images alongside other data fields. This includes basic functions like cropping, rotating, resizing, and adding annotations. It's useful for tasks such as cleaning up user-uploaded files, adjusting product photos, or marking up visual references—all without switching to another application. This keeps image handling part of the same process as your data updates.
Several .NET data editor collections provide an image editor, including:
For an in-depth analysis of features and price, visit our .NET data editors comparison.

ComponentSource and combit have partnered for 15 years, providing developers worldwide with powerful reporting, reporting designers, and data visualization tools to build professional, data-driven applications.
combit is a leading provider of reporting components for software developers, best known for List & Label – a multiple award-winning reporting tool used by development teams around the globe. Their components make it easier to design and integrate customized reports, dashboards, lists, and labels into business applications. Through ComponentSource, customers can conveniently license, and maintain these combit products, confident they’re choosing proven technology backed by professional support and ongoing innovation.
Together, ComponentSource and combit help development teams deliver applications faster, with flexible licensing options, reliable updates, and expert assistance. As demand for advanced reporting and analytics continues to grow, this long-standing collaboration ensures customers can rely on a trusted combination of combit’s technology and ComponentSource’s global distribution and customer service for many years to come.
Learn more about combit.
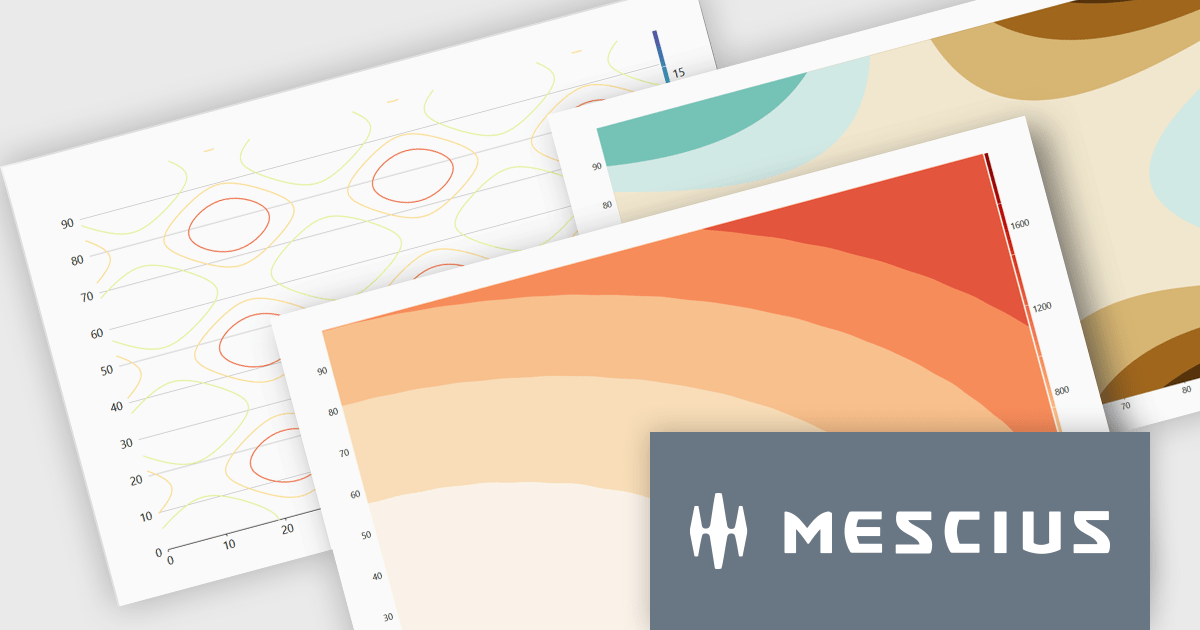
ComponentOne Studio Enterprise is a comprehensive suite of .NET UI controls developed by MESCIUS (formerly GrapeCity) designed for building rich, interactive desktop, web, and mobile applications. It provides developers with a broad range of tools and components-including data grids, charts, reports, input controls, and advanced data visualization features-for platforms such as WinForms, WPF, ASP.NET Core, Blazor, WinUI, and .NET MAUI. The suite emphasizes performance, flexibility, and ease of integration, helping teams create consistent, feature-rich user experiences across multiple application types while maintaining a unified development approach.
The ComponentOne Studio Enterprise 2025 v2 update introduces 2D Contour Charts in FlexChart for WPF, allowing developers to represent three-dimensional data on a two-dimensional surface through contour lines or shaded bands that highlight areas of equal value. This capability delivers a clear visual understanding of gradients, surface characteristics, and other continuous data patterns. With support for multiple contour types, customizable contour levels, and flexible gradient color palettes, developers gain precise control over how value transitions are presented. These enhancements make the WPF contour chart well suited for scientific and engineering analysis, elevation and surface mapping, and any application that requires accurate comparison of value distribution across two variables.
To see a full list of what's new in 2025 v2, see our release notes.
ComponentOne Studio Enterprise is licensed per developer on a perpetual basis and includes a 12 month subscription. Priority Support is also available. See our ComponentOne Studio Enterprise licensing page for full details.
Learn more on our ComponentOne Studio Enterprise product page.

Telerik UI for WPF and Telerik UI for WinForms are commercial UI suites that help developers build modern, visually appealing and highly functional Windows applications. Telerik UI for WinForms provides more than 160 robust controls with a well designed architecture and CAB support, making it ideal for enterprise line of business, data intensive and internal desktop apps that demand reliability and rapid development. Telerik UI for WPF is tailored for Windows Presentation Foundation and offers high performance, visually rich and highly customizable controls for advanced line of business scenarios. By using these toolsets, teams can deliver engaging user experiences while reducing time to market and long term maintenance effort.
The Telerik 2025 Q4 update for WPF and WinForms introduces AI powered PDF querying and summarization. By allowing users to ask direct questions about PDF content and receive concise, context aware answers, the enhanced PDF Viewer reduces the time spent navigating long contracts, reports and technical documentation. This capability improves information retrieval and adds meaningful value to document heavy applications by enabling faster access to the specific details users need without manual searching or scrolling.
To see a full list of what's new for each product in 2025 Q4, see our Telerik UI for WPF and Telerik UI for WinForms release notes.
Both Telerik UI for WPF and Telerik UI for WinForms are licensed per developer and have two licensing models: an annual Subscription License and a Perpetual License. The Subscription license provides access to the latest product updates, technical support, and exclusive benefits for a flat annual fee, and must be renewed to continue using the software. The Perpetual license is a one-time purchase granting access to the current released version and includes a one-year subscription for product updates and technical support. After this initial period, users can choose to renew the subscription element to continue receiving updates and support; otherwise, they may continue using the installed version available during their active subscription term but will forgo future updates and support. See our Telerik UI for WPF licensing page and Telerik UI for WinForms licensing page for full details.
Telerik UI for WPF and Telerik UI for WinForms are available individually or as part of the following products:


Tel: (888) 850 9911
Fax: +1 770 250 6199


