








Fornitore ufficiale
In qualità di distributori ufficiali e autorizzati, forniamo licenze software legittime direttamente da più di 200 autori di software.
Vedi tutte le nostre marche

Calculated fields are dynamic values derived from existing data within reporting components. They enable complex data manipulations, calculations, and transformations, providing enhanced data analysis capabilities. By creating new fields based on existing data, calculated fields offer flexibility and efficiency, allowing users to perform calculations, aggregations, and logical comparisons directly within the report. This empowers users to generate insights, visualize trends, and make data-driven decisions without requiring modifications to the underlying data source, ultimately improving report accuracy and usability.
Several Vue.js reporting components offer support for calculated fields:
For an in-depth analysis of features and price, visit Vue.js reporting components comparison.
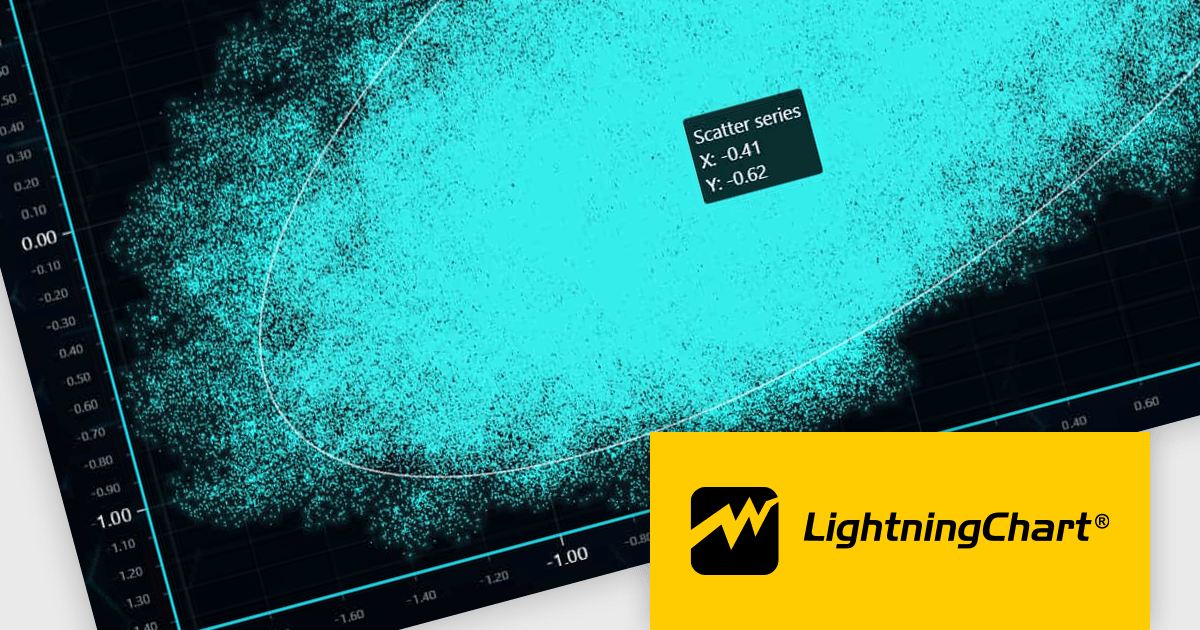
LightningChart JS is a high-performance JavaScript charting library optimized for real-time data visualization. Leveraging WebGL and GPU acceleration, it enables developers to create interactive, complex charts capable of handling massive datasets with high refresh rates. Ideal for applications demanding rapid data updates and smooth interactions, LightningChart JS provides a robust API for customization and integration into web-based projects.
The LightningChart JS v6.0.0 update introduces enhanced cursor capabilities, providing developers with greater control over cursor behavior and appearance. New features include custom cursor shapes, dynamic cursor updates based on data points, and precise cursor positioning, allowing for more informative and interactive visualizations. These improvements facilitate the creation of tailored user experiences and enable developers to effectively convey complex data insights through intuitive cursor interactions.
LightningChart JS v6.0.0 cursor improvements include:
To see a full list of what's new in v6.0.0, see our release notes.
LightningChart JS is licensed based on method of deployment with options including SaaS Developer Licenses, Application Developer Licenses, and Publisher Developer Licenses. Each license is perpetual and includes 1 year subscription for technical support and software updates. See our LightningChart JS licensing page for full details.
Learn more on our LightningChart JS product page.
Syncfusion Essential Studio Enterprise provides a comprehensive collection of UI components and frameworks for building modern cross-platform applications. It offers over 1,800 components compatible with .NET WinForms, WPF, ASP.NET Core & MVC, WinUI, MAUI, JavaScript, Xamarin, Blazor, and more, enabling seamless application development across diverse devices and operating systems.
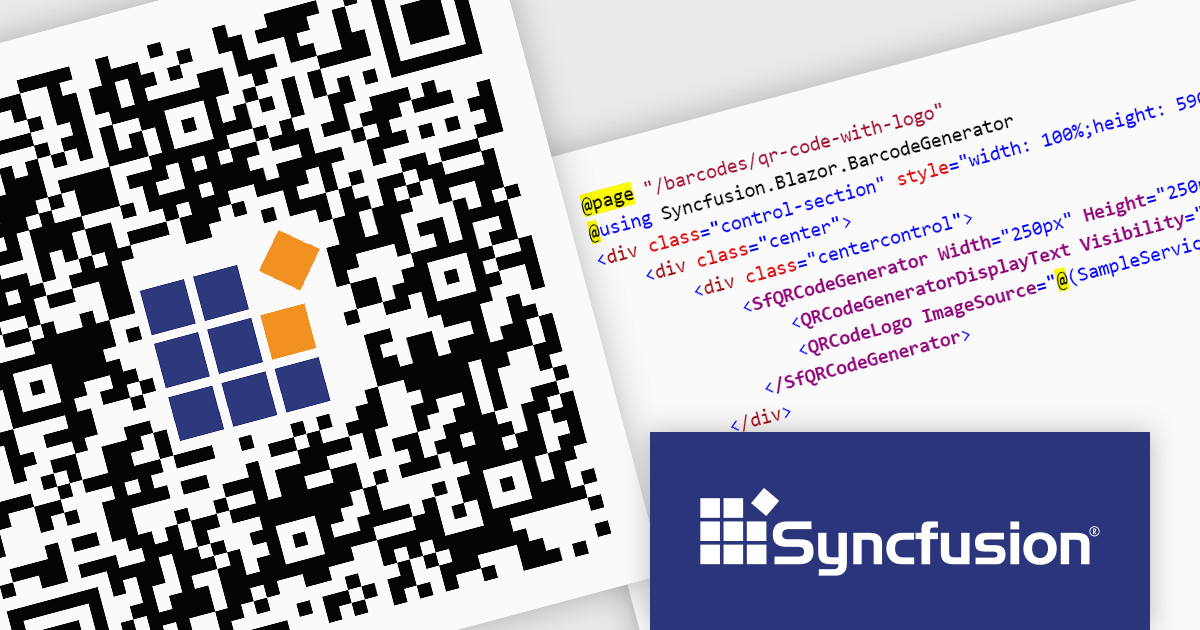
The Syncfusion Essential Studio Enterprise 2024 Volume 2 SP1 (26.2.4) release introduces the ability to embed a custom logo within generated QR codes, empowering businesses to enhance brand recognition and user engagement. By seamlessly integrating company branding into these ubiquitous codes, organizations can create a more distinctive and memorable user experience, fostering stronger brand recall and driving increased interaction with marketing materials and digital content.
To see a full list of what's new in 2024 Volume 2 SP1 (26.2.4), see our release notes for ASP.NET Core, ASP.NET MVC, Blazor, and JavaScript.
Syncfusion Essential Studio ASP.NET Core, ASP.NET MVC, Blazor and JavaScript are available as part of Syncfusion Essential Studio Enterprise which is licensed per developer starting with a Team License of up to five developers. It is available as a 12 Month Timed Subscription License which includes support and maintenance. See our Syncfusion Essential Studio Enterprise licensing page for full details.
Learn more on our ASP.NET Core, ASP.NET MVC, Blazor, and JavaScript product pages.

Gauge controls are visual components employed in software development to represent numerical data in a graphical format. They effectively communicate quantitative information at a glance, aiding rapid decision-making. Common types include radial, linear, and circular gauges. Primarily utilized in dashboards and monitoring interfaces, gauges excel at displaying performance metrics, system health indicators, and real-time data trends. Their intuitive design enhances user experience by providing immediate insights into key performance indicators (KPIs) and facilitating efficient analysis.
Several Vue.js UI suites offer gauge controls including:
For an in-depth analysis of features and price, visit our Vue.js UI suites comparison.

Rich text editor components offer a familiar interface for users to format text, insert images and tables, and create structured content. Benefits include increased user engagement, simplified content creation, and improved accessibility for users with varying technical skills. Common use cases include crafting blog posts, product descriptions, and managing user-generated content within forums and comments sections.
Several Vue.js UI Suites offer rich text functionality, including:
For an in-depth analysis of features and price, visit our comparison of Vue.js UI Suites.





Tel: (888) 850 9911
Fax: +1 770 250 6199


