








Fornitore ufficiale
In qualità di distributori ufficiali e autorizzati, forniamo licenze software legittime direttamente da più di 200 autori di software.
Vedi tutte le nostre marche
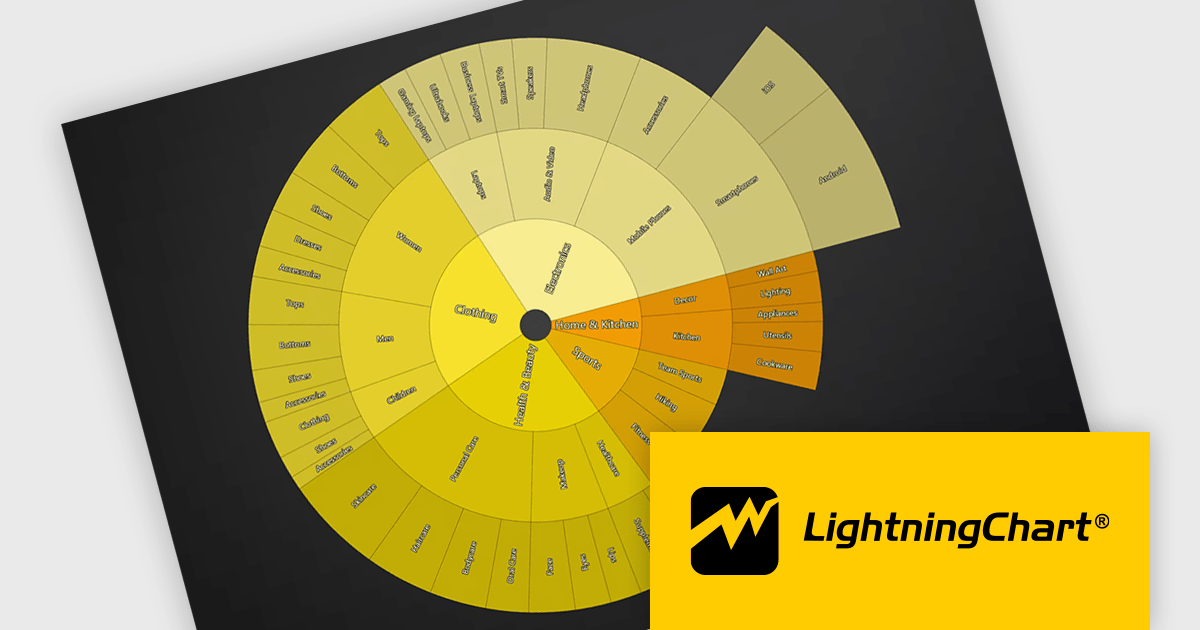
LightningChart JS is a high-performance JavaScript charting library that utilizes WebGL rendering and GPU acceleration to deliver exceptional performance for a wide range of data visualization needs. It is designed to handle large datasets and complex visualizations with ease, enabling developers to create interactive and visually appealing 2D and 3D charts. Ideal for applications demanding smooth real-time data updates, such as financial platforms, engineering tools, scientific research dashboards, and industrial monitoring systems, LightningChart JS provides a comprehensive API for customization and integration into web-based projects.
The LightningChart JS v8.3 update introduces Sunburst charts, enabling developers to visualize hierarchical data in a compact and intuitive format that clearly represents part to whole relationships across multiple levels. By displaying nested categories as proportionally sized segments within concentric rings, the chart makes it easier to analyze complex data structures, compare contributions at different hierarchy levels, and identify patterns or dominant categories without requiring multiple visualizations. This helps developers deliver more informative data exploration experiences in applications that rely on organizational, financial, operational, or other structured datasets.
To see a full list of what's new in v8.3, see our release notes.
LightningChart JS is licensed per developer and is available as an annual license with 1 year support. See our LightningChart JS licensing page for full details.
For more information, see our LightningChart JS product page.
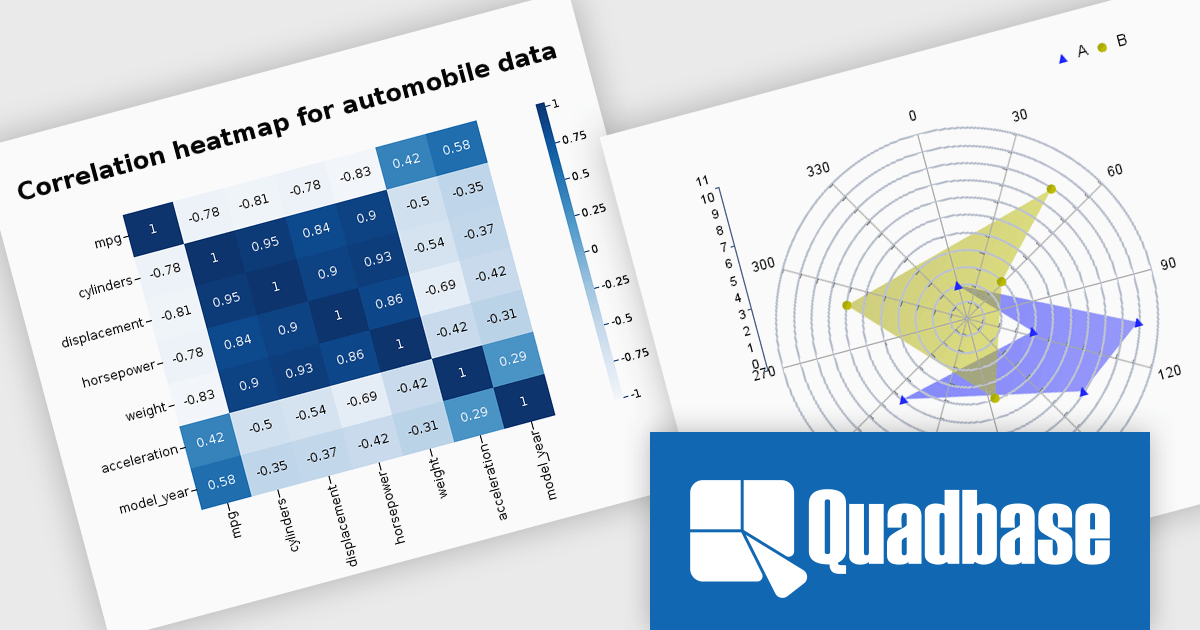
EspressChart is a Java-based business intelligence and data visualization solution that enables organizations to create and deploy interactive, highly customizable charts for web and enterprise applications. With its robust API and intuitive Chart Designer, users can easily build visualizations featuring advanced capabilities such as drilldown, parameterization, and statistical analysis. Supporting multiple output formats, including PNG, JPEG, GIF, PDF, WMF, and SVG, EspressChart integrates seamlessly into applications and dashboards, helping businesses transform complex data into clear insights for reporting, analytics, and informed decision-making.
The EspressChart 7.2 update modernizes the charting and data visualization platform by introducing support for Jakarta EE 11, JDK 21, and Tomcat 11. For developers building reporting, dashboard, and business intelligence applications, this provides access to the latest enterprise Java standards and runtime technologies, enabling easier integration, improved application performance, and greater deployment flexibility. The update helps ensure that EspressChart based solutions remain compatible with modern Java environments while simplifying platform upgrades and reducing reliance on legacy infrastructure.
To see a full list of what's new in v7.2, see our release notes.
EspressChart is licensed on a per machine basis, with separate Development and Server/Deployment licenses available to support both application development and production deployment. See our EspressChart licensing page for full details.
For more information, see our EspressChart product page.
Wijmo is a cutting-edge collection of over 100 high-performance JavaScript UI controls designed for modern enterprise applications. It empowers developers to deliver superior user experiences with fully responsive, touch-friendly, and accessible components and works with any popular JavaScript framework - including Angular, React, Vue, Svelte, or pure JavaScript/TypeScript - for rapid application development across modern web and mobile platforms.
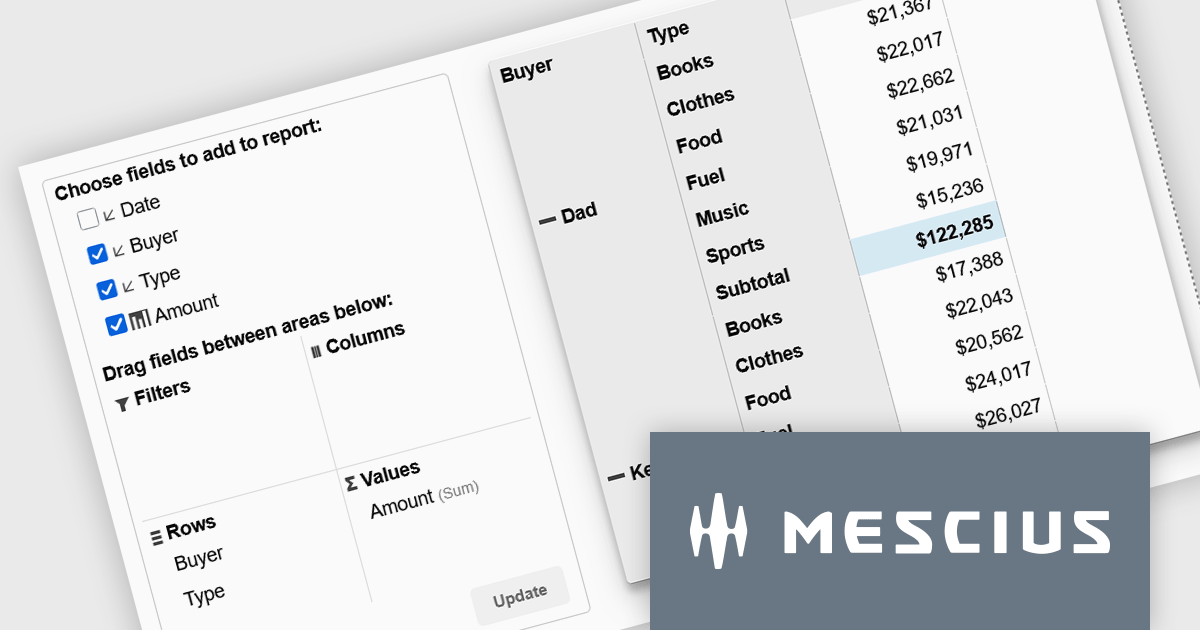
On Wednesday, July 8th at 11:00 AM EST, MESCIUS is presenting a CodeClinic Live Webinar demonstrating how to create executive-ready dashboards without requiring you to build complex aggregation logic from scratch. Joel Parks, Wijmo Product Manager for MESCIUS, will demonstrate how PivotGrid and PivotChart work together to deliver a seamless analytics experience. Key takeaways include:
Register for the Live Webinar today and mark your calendar for July 8th.
Wijmo is licensed per developer. Developer Licenses are perpetual and include 1 year Subscription which provides upgrades, including bug fixes and new features. See our Wijmo licensing page for full details.
Learn more on our Wijmo product page.
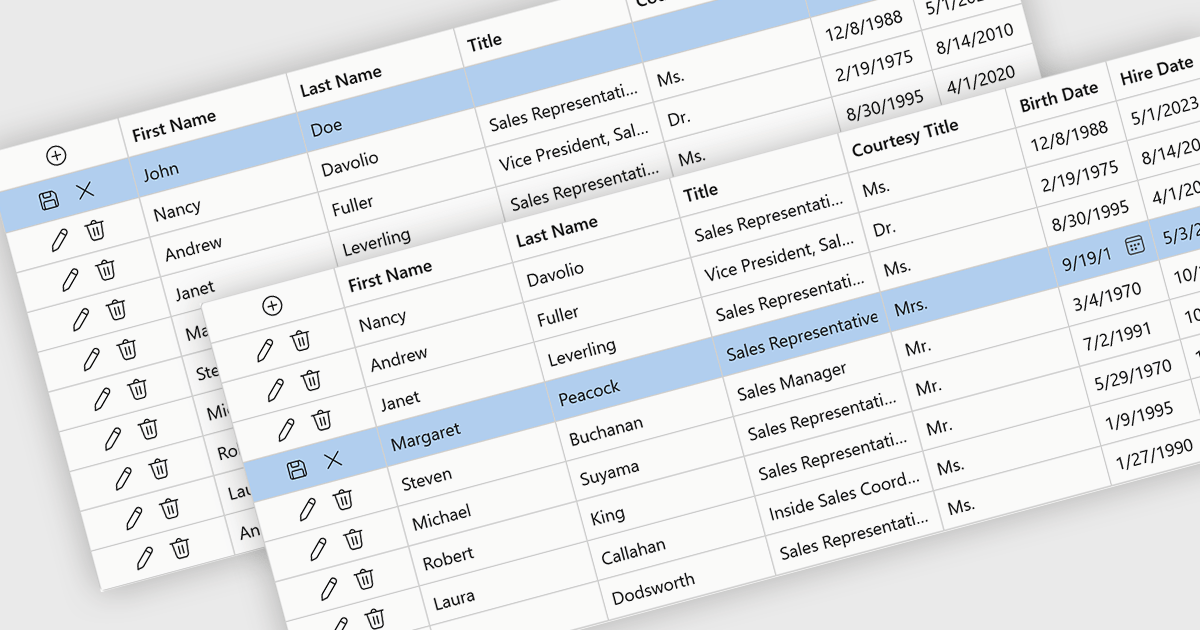
Row editing in grids allows users to update an entire record directly within a data grid, editing multiple fields at once without opening a separate form. This improves productivity by reducing clicks, keeping users in context, and making data updates faster and more intuitive. It also helps improve accuracy by allowing related information to be reviewed and validated together. Common use cases include managing customer records, updating inventory, processing orders, and maintaining employee or financial data in business applications.
Several .NET Blazor components provide data grids that allow row editing, including:
For an in-depth analysis of features and price, visit our comparison of .NET Blazor grid components.
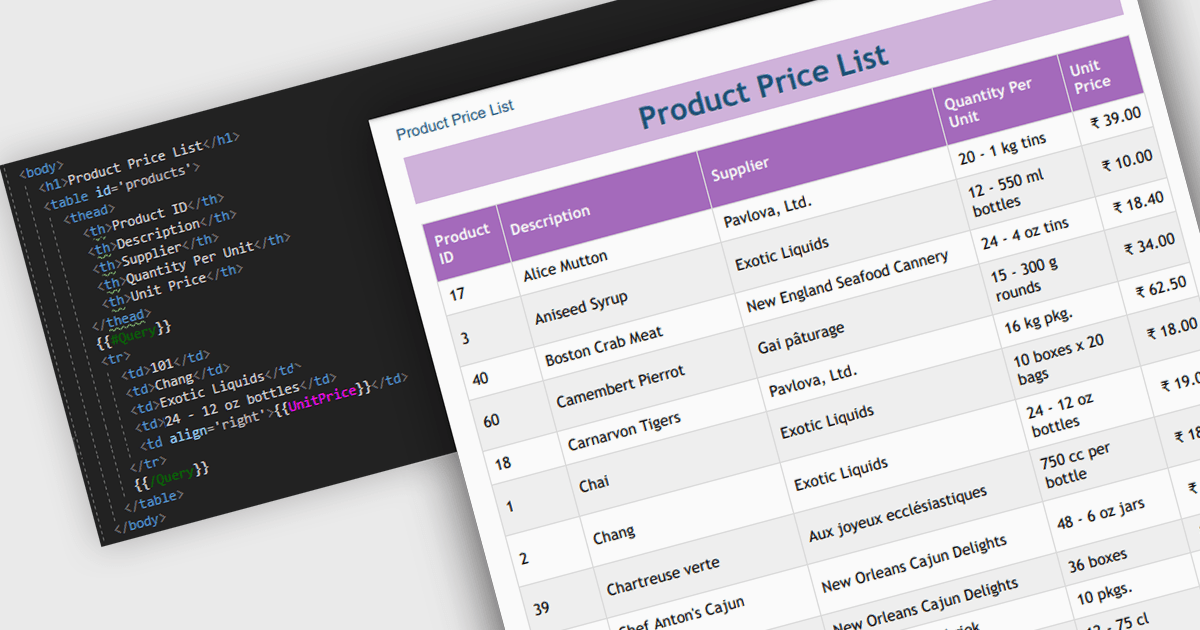
Convert HTML to PDF is a feature in a .NET PDF Viewer component that enables developers to generate PDF documents from HTML content, including text, images, styles, and web-based layouts, while preserving the original formatting. It is commonly used for creating reports, invoices, forms, and archived web content directly within .NET applications. The capability helps maintain consistent document presentation across platforms, supports automated document generation workflows, reduces the need for manual formatting, and allows existing HTML and CSS assets to be reused when producing professional-quality PDF output.
Several .NET PDF components offer convert HTML to PDF including:
For an in-depth analysis of features and price, visit our comparison of .NET PDF components.





Tel: (888) 850 9911
Fax: +1 770 250 6199


