


Fornitore ufficiale
In qualità di distributori ufficiali e autorizzati, forniamo licenze software legittime direttamente da più di 200 autori di software.
Vedi tutte le nostre marche
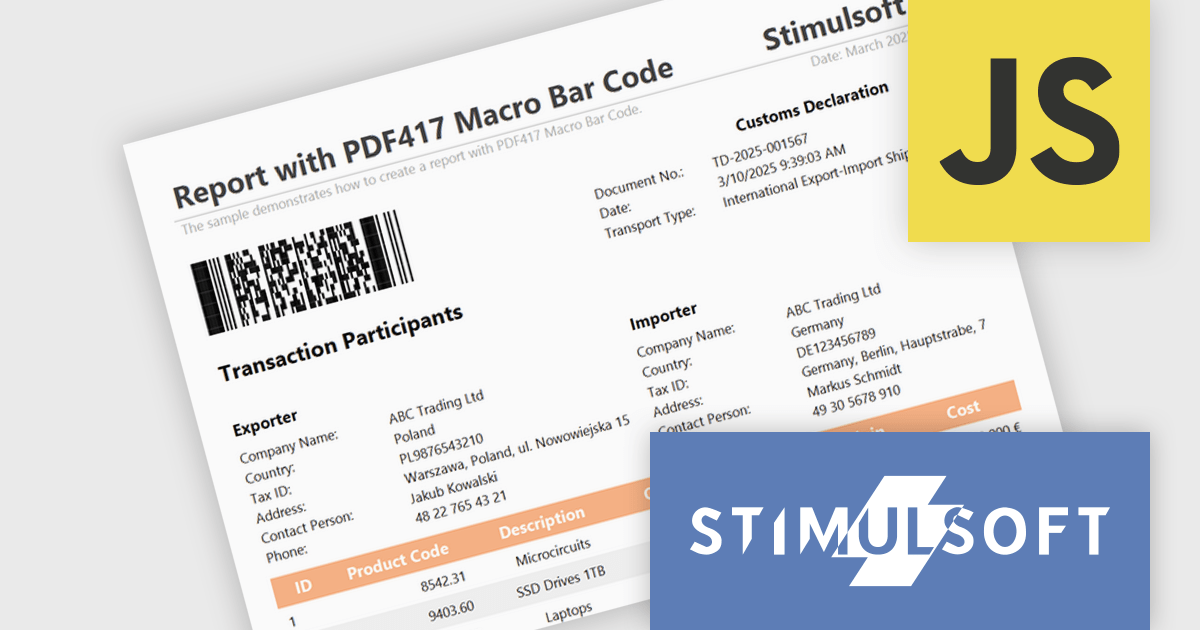
Stimulsoft Reports.JS provides a robust reporting toolkit designed specifically for JavaScript applications. This library leverages a client-side architecture, offering a pure JavaScript report engine for efficient report rendering directly within web browsers. The solution includes a user-friendly report designer for building reports with various data sources and visualizations, along with a report viewer for seamless integration and display within your JavaScript applications. This eliminates the need for server-side dependencies or browser plugins, simplifying the development process for embedding powerful reporting functionalities into your web projects.
The Stimulsoft Reports.JS 2025.2.1 update introduces support for the Macro PDF417 barcode, allowing developers to handle larger data payloads within reports. Unlike the standard PDF417 barcode, which is limited in data capacity, the Macro PDF417 format enables the encoding of large data files by splitting them into multiple linked symbols. This enhancement is particularly useful when working with high-volume or multi-page reports, providing a reliable solution for encoding structured data without compromising layout or readability.
To see a full list of what's new in 2025.2.1, see our release notes.
Stimulsoft Reports.JS is licensed per developer and is available as a Perpetual license with 1 year support and maintenance. See our Stimulsoft Reports.JS licensing page for full details.
Stimulsoft Reports.JS is available individually or as part of Stimulsoft Ultimate.
Telerik Reporting is a comprehensive and lightweight embedded reporting tool for .NET web and desktop applications. It enables developers and reporting users to create, design, and export visually appealing, interactive, and reusable reports to effectively present analytical and business data. It supports various technologies, including ASP.NET Core, Blazor, ASP.NET MVC, ASP.NET AJAX, HTML5/JS, Angular, WPF, WinForms, and WinUI.
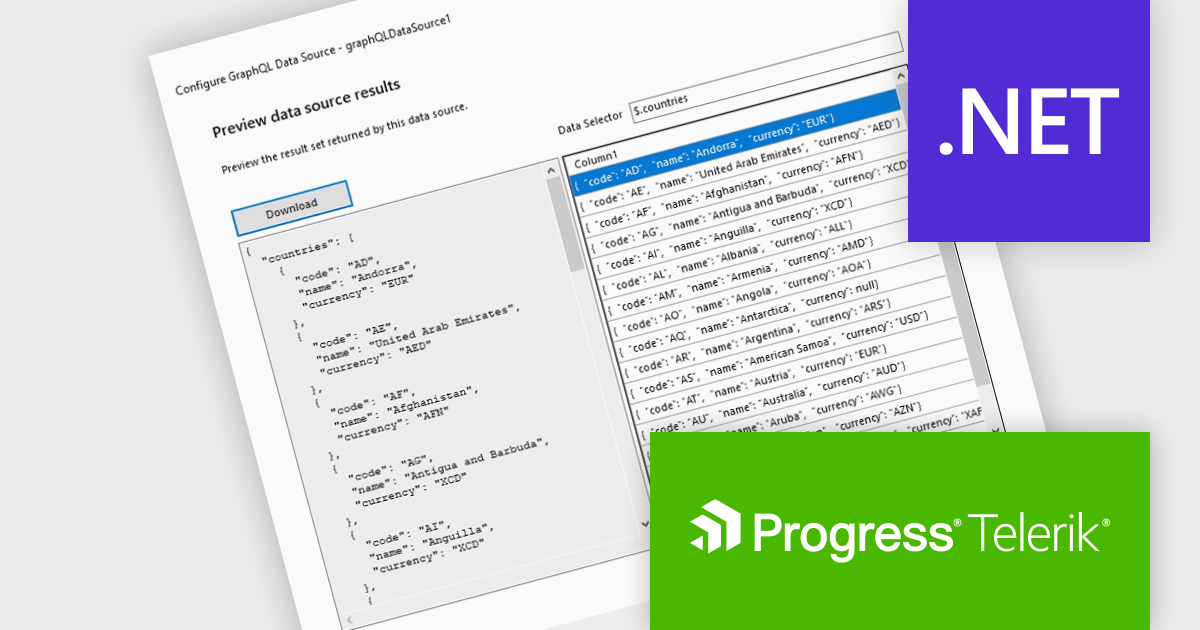
The Telerik Reporting 2025 Q1 update introduces GraphQL native support with a dedicated GraphQLDataSource component, allowing developers to seamlessly connect reports to GraphQL APIs. This enhancement streamlines data retrieval by enabling precise queries that fetch only the necessary information, optimizing performance and reducing overhead. The Standalone Report Designer now includes an intuitive wizard that simplifies the setup process, guiding users through creating and configuring GraphQL data sources with minimal effort. By integrating GraphQL natively, Telerik Reporting enhances flexibility and efficiency, empowering developers to build dynamic, data-driven reports with greater ease and precision.
To see a full list of what's new in 2025 Q1 (19.0.25.211), see our release notes.
Telerik Reporting is licensed per developer and is available as a perpetual license with a one year support subscription, which is offered in three tiers: Lite, Priority or Ultimate. See our Telerik Reporting licensing page for full details.
Telerik Reporting is available to buy in the following products:
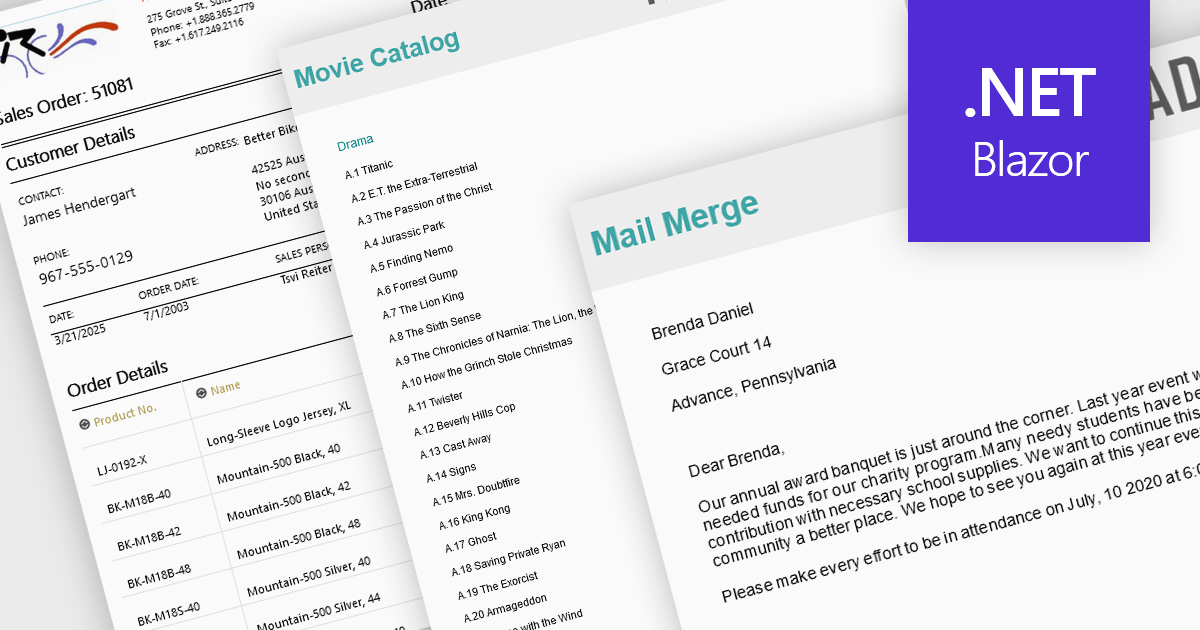
Advanced layout and formatting features are essential for producing professional, polished reports that align with both technical and business requirements. These capabilities enhance the structure and presentation of report content, supporting better readability, navigation, and customization. Whether delivering print-ready documents or dynamic digital reports, advanced formatting tools ensure consistency and flexibility in how data and visual elements are displayed.
Common features include:
For an in-depth analysis of features and price, visit our Blazor Reporting components comparison.
Telerik Report Server is a comprehensive and flexible end-to-end solution for managing reports. Built with the Telerik Reporting library, it is a server-based Windows web application that provides centralized storage, organization, and previewing of reports, along with features for scheduling, delivery, and user management. Report Server can act as a standalone solution or be integrated within an application, allowing developers to create, manage, and distribute reports across multiple platforms including Blazor, Angular and Windows Forms.
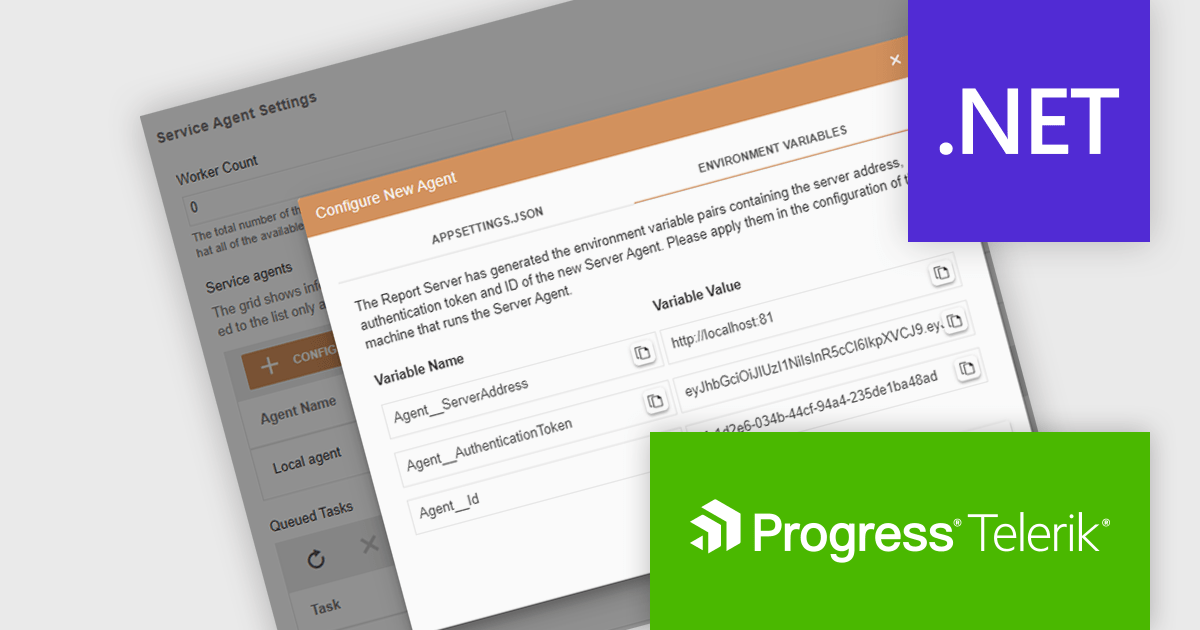
The Telerik Report Server 2025 Q1 update introduces the Server Agents Manager, providing software developers with a centralized and intuitive interface for managing Server Agents across multiple machines. This enhancement improves visibility into agent statuses and tasks, allowing for more precise control over scheduled report processing, data caching, and overall workload distribution. Developers can efficiently add, modify, or remove agents, monitor real-time execution, and cancel ongoing tasks as needed to optimize performance and resource utilization. By streamlining agent management and increasing operational transparency, this update ensures a more scalable, efficient, and reliable reporting environment.
To see a full list of what's new in 2025 Q1 (11.0.25.211), see our release notes.
Telerik Report Server is licensed per developer and has two licensing models: an annual Subscription License and a Perpetual License. The Subscription license provides access to the latest product updates, technical support, and exclusive benefits for a flat annual fee, and must be renewed to continue using the software. The Perpetual license is a one-time purchase granting access to the current released version and includes a one-year subscription for product updates and technical support. After this initial period, users can choose to renew the subscription element to continue receiving updates and support; otherwise, they may continue using the installed version available during their active subscription term but will forgo future updates and support. See our Telerik Report Server licensing page for full details.
Telerik Report Server is available individually or as part of Telerik DevCraft Ultimate.
ActiveReports.NET helps you deliver beautiful reports with intuitive Visual Studio integrated report designers and rich controls. It provides code-based cross-platform reporting, easy-to-use designers, and a flexible API, enabling you to design and deliver powerful reports with intuitive, reliable, and user-friendly report designers and controls.
In this blog post, MESCIUS Product Manager Alec Gall shows you how to use ActiveReports to drill through from one report to another in your .NET application. Steps include:
Detailed source code is completed and there is even a video that you can watch as you go through the steps.
Read the complete blog and begin providing a seamless way to navigate between related datasets in your .NET applications.
ActiveReports.NET is licensed per developer and is available with or without a 12 month support and maintenance subscription. See our ActiveReports.NET licensing page for full details.
Learn more on our ActiveReports.NET product page.


Tel: (888) 850 9911
Fax: +1 770 250 6199


