


Fornitore ufficiale
In qualità di distributori ufficiali e autorizzati, forniamo licenze software legittime direttamente da più di 200 autori di software.
Vedi tutte le nostre marche
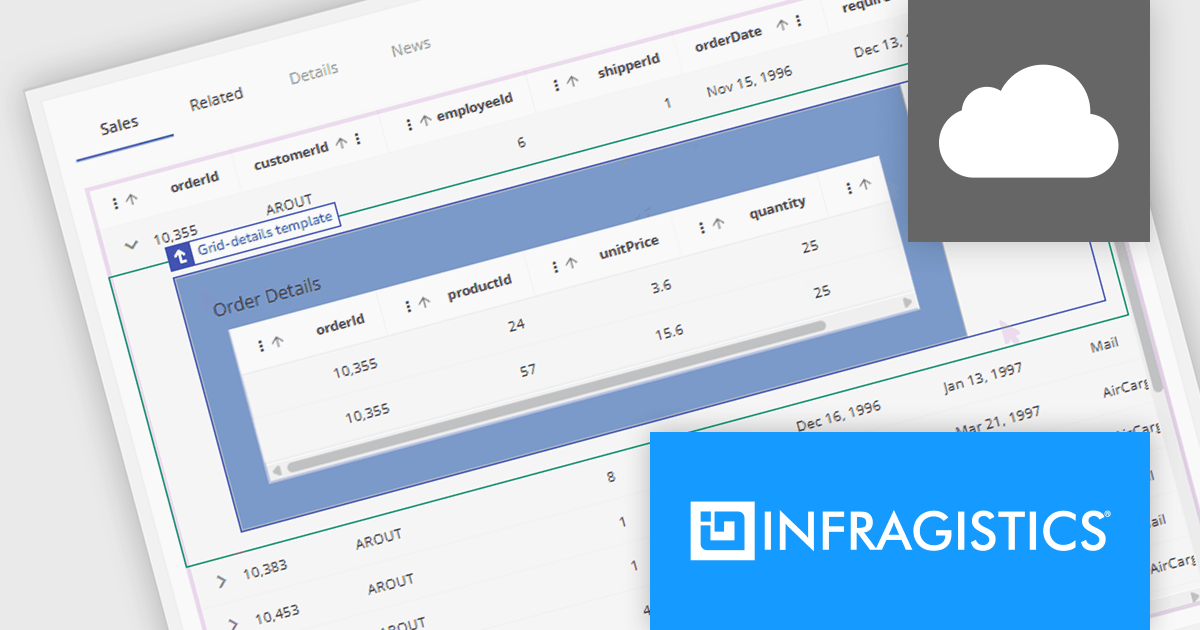
Infragistics App Builder is a cloud-based, WYSIWYG development tool that streamlines enterprise application creation through drag-and-drop functionality. Designed to accelerate development lifecycles, it empowers users to build business apps more quickly with features like prebuilt templates, real-time code generation, and instant previews. This low-code approach is ideal for businesses seeking to improve development efficiency and shorten time-to-market for web applications.
The new App Builder release supports master-detail templates that allow you to create expandable rows within data grids. This feature makes it easy to surface related information without leaving the grid view. Users can click to expand a row and immediately view details that are contextually relevant to that specific item. Developers can design these views using drag-and-drop components like cards, images, and text blocks, all bound to the active row’s data. Everything is managed through App Builder’s visual Properties panel, where enabling the “Grid-details” option unlocks the new functionality. This gives teams a fast way to build dynamic and informative user interfaces with less overhead and no need to write boilerplate code.
To see a full list of what's new, see our release notes.
Infragistics App Builder is licensed per developer as an annual subscription. See our Infragistics App Builder licensing page for full details.
Infragistics App Builder is available individually or as part of Infragistics Ultimate.
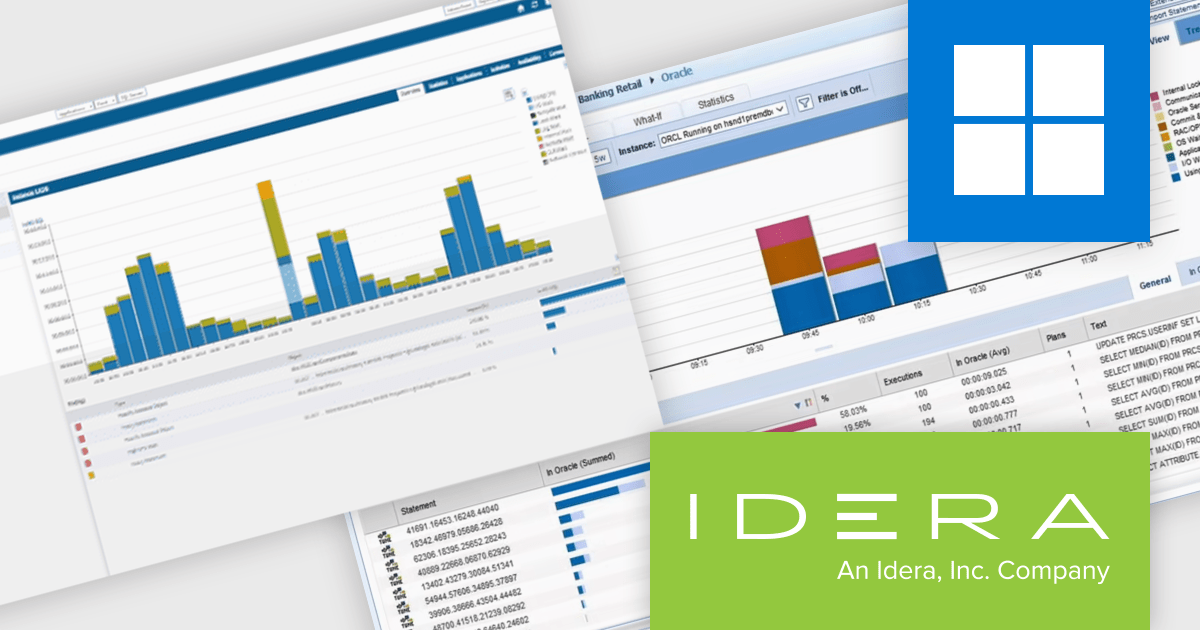
Precise for Databases by IDERA is a performance monitoring and tuning tool for databases like Oracle, SQL Server, Db2, and SAP Sybase ASE. It tracks transactions in real time with minimal overhead, providing detailed visibility into SQL execution, resource usage, and wait events. Features include advanced tuning advice, historical analysis, and visual dashboards to help teams quickly identify and resolve performance issues. Designed for both on-premises and cloud environments, Precise helps developers and DBAs ensure consistent performance and streamline troubleshooting in complex database systems.
Precise for Databases enables software developers to track the performance of database transactions in real time, providing clear visibility into execution paths, resource usage, and query behavior. By monitoring each transaction as it flows through the system, developers can quickly identify inefficient SQL statements, diagnose the root cause of performance bottlenecks, and validate the impact of code or schema changes. This level of insight helps reduce troubleshooting time, improve application responsiveness, and ensure that database interactions are optimized for both stability and speed.
Precise for Databases is licensed per database instance. See our Precise for Databases licensing page for full details.
Learn more on our Precise for Databases product page.
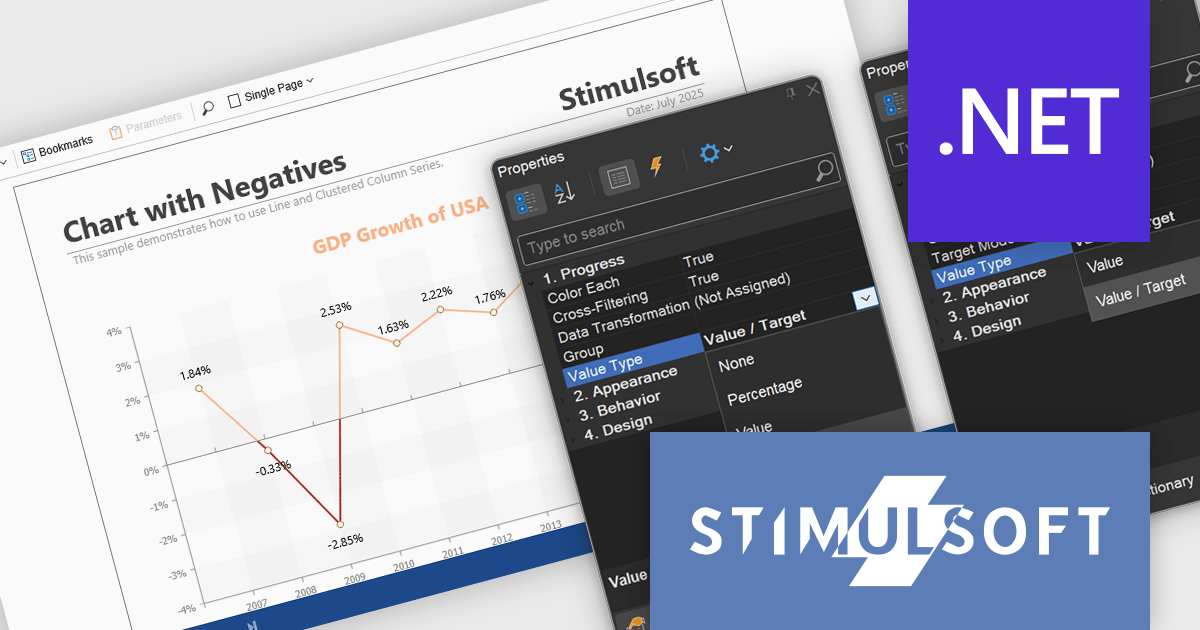
Stimulsoft Reports.NET is a reporting tool that empowers developers to design, edit, view, export, and print reports of varying complexity. It features a user-friendly report designer and an interactive viewer, allowing connection to various data sources. The generated reports can be seamlessly integrated into both Windows Forms and ASP.NET applications, with export capabilities to numerous formats for maximum flexibility.
The Stimulsoft Reports.NET 2025.3.1 update enhances the Value Type property by allowing developers to customize how values are displayed in Progress and Indicator dashboard elements. Progress elements can now show raw values, percentages, or value and target pairs, while Indicator elements support raw values or value and target formats. This added flexibility helps developers present data in the most relevant format for their users, improving clarity and making dashboards more informative and purpose-driven.
To see a full list of what's new in 2025.3.1, see our release notes.
Stimulsoft Reports.NET is licensed per developer and is available as a perpetual license with 1 year support and maintenance. See our Stimulsoft Reports.NET licensing page for full details.
Stimulsoft Reports.NET is available in the following products:
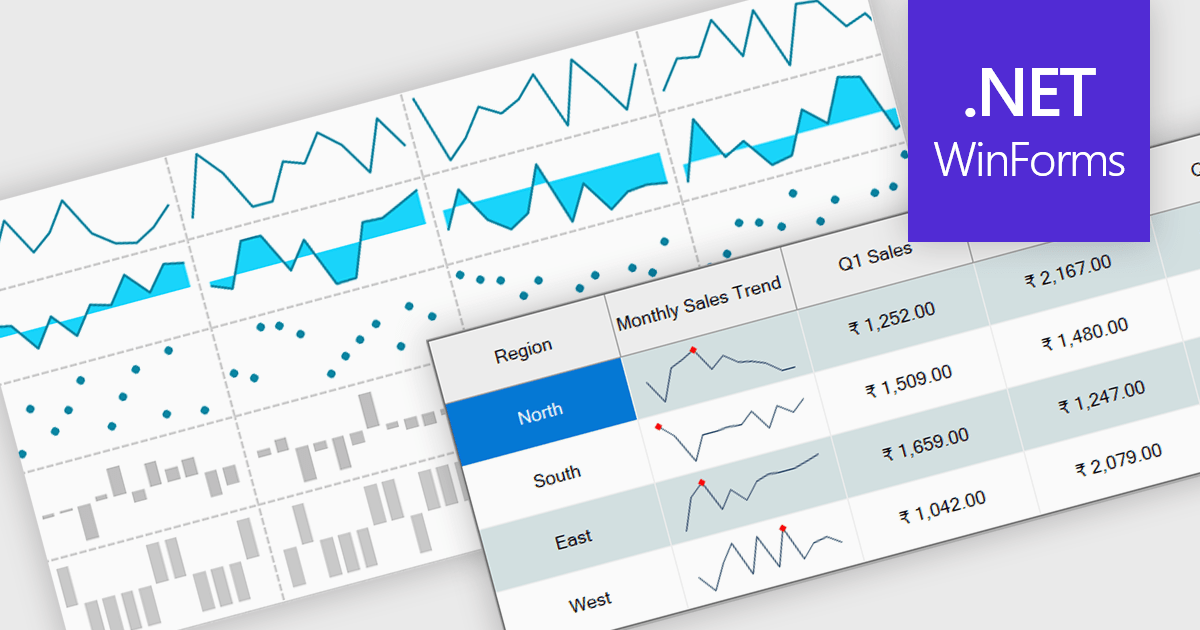
Sparklines are small embedded charts displayed within individual cells of a data grid or table, offering a compact and intuitive way to visualize trends, patterns and variations in data. Unlike traditional charts, sparklines are designed to fit alongside text or numerical values, providing immediate visual context without taking up additional space. This makes them ideal for high density dashboards and reports where space efficiency and quick interpretation are important. By enabling users to scan and compare trends across multiple rows at a glance, sparklines support faster decision making and improved data comprehension. Common use cases include tracking stock performance over time, visualizing monthly sales trends, monitoring temperature fluctuations or comparing website traffic across multiple pages directly within the grid.
Several .NET Winforms grid controls offer support for sparklines including:
EspressReport by Quadbase Systems is a robust Java-based reporting and business intelligence solution designed for integration into applications, servlets, and JSP environments. With a comprehensive visual report designer and a rich API toolkit, EspressReport enables users to create dynamic and interactive reports tailored to enterprise needs. Its cross-platform compatibility makes it a flexible choice for organizations operating across a variety of system environments, including Windows, Linux, macOS, and Unix.
EspressReport offers a powerful set of features that support versatile data connectivity, advanced charting capabilities, and a wide range of output formats such as PDF, Excel, and HTML. Users benefit from intuitive visual design tools, multi-source data integration, and customizable report parameters, making it suitable for both technical developers and business users. Common use cases include financial reporting, operational reports, data visualization, and scheduled report distribution, helping organizations transform raw data into clear, actionable insights.
EspressReport is available as either a Development License or a Server/Deployment License. The Development License allows one developer to install and use the design tools on a single machine for development purposes. It does not permit any deployment or distribution of applications. The Server/Deployment License, is designed for running EspressReport-based solutions in server environments, including applications, servlets, and JSPs, and is priced per server CPU. Licenses come with Annual Support & Maintenance for email/phone support, patches, and upgrades. See our EspressReport licensing page for full details.
For more information visit our EspressReport product page.


Tel: (888) 850 9911
Fax: +1 770 250 6199


