


Fornitore ufficiale
In qualità di distributori ufficiali e autorizzati, forniamo licenze software legittime direttamente da più di 200 autori di software.
Vedi tutte le nostre marche
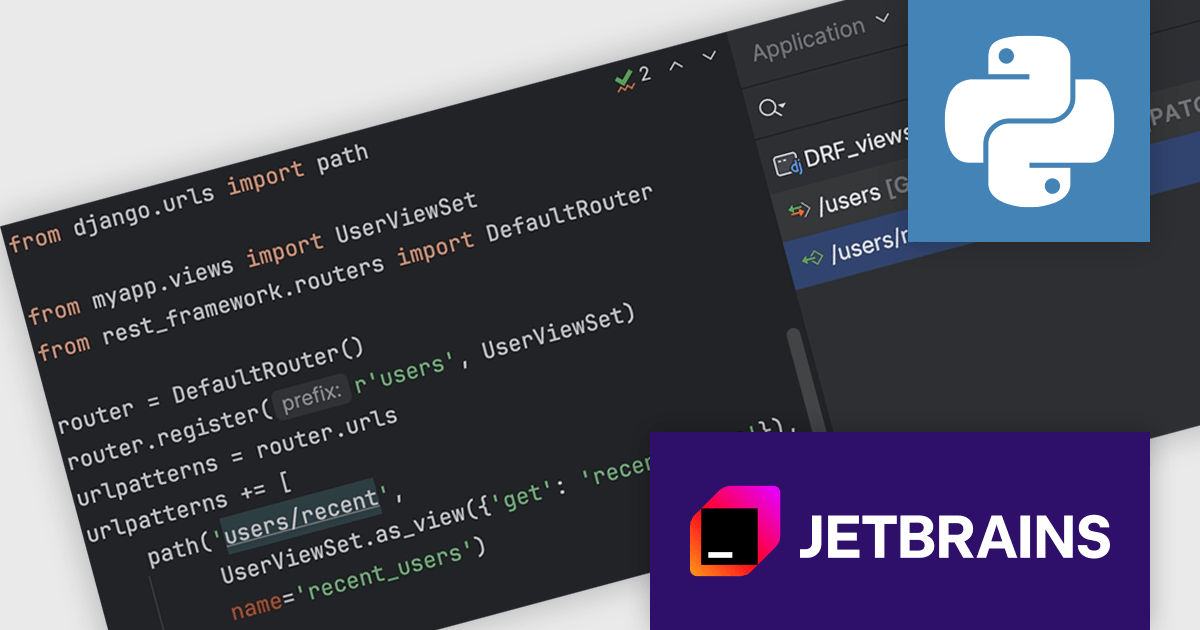
PyCharm by JetBrains is a comprehensive Integrated Development Environment (IDE) specifically designed for Python programming. It offers a range of features to enhance productivity, including code analysis for error detection, a visual debugger for troubleshooting, integrated unit testing for code verification, and support for version control systems to manage code changes. PyCharm also caters to web development using frameworks like Django, making it a powerful tool for both experienced developers and beginners in the Python world.
PyCharm 2024.1.2 offers enhanced support for Django REST Framework (DRF) viewsets and routers. Users can define not only function-based and class-based views in URL paths, but also leverage viewsets and view their corresponding actions within the tool window. This improved functionality extends to HTTP methods, allowing users to map them to viewset methods and see them displayed alongside the relevant routes, including custom methods not decorated with @actions. Additionally, routes without these decorators are now presented with their associated viewset methods for clarity.
To see a full list of what's new in version 2024.1.2, see our release notes.
PyCharm is licensed per user, and is available as a commercial annual subscription license. We can supply new subscriptions, subscription renewals (including continuity discounts), lapsed renewals, and additional user licenses. See our PyCharm licensing page for full details.
PyCharm is available to buy in the following products:
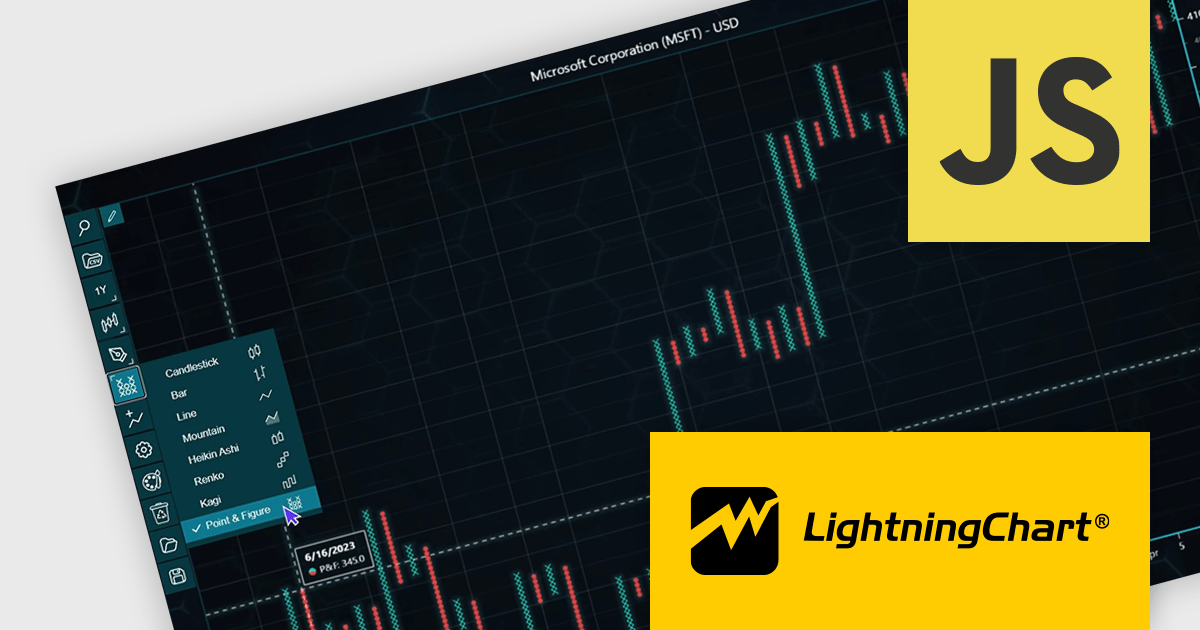
LightningChart JS Trader is a JavaScript/TypeScript library developed by LightningChart that specifically targets the creation of financial and trading applications. It provides high-performance, 2D, 3D, and real-time charting controls and a comprehensive suite of visualizations including candlestick, bar, line, and various technical indicators and drawing tools. This library enables software developers to craft interactive technical analysis tools without the need for server-side setup as it runs completely on the client device.
The LightningChart JS Trader v2.0 update expands its technical analysis toolkit by introducing more chart types, such as Heikin Ashi, Renko, Kagi, and Point-and-Figure charts. These additional chart types equip developers with a wider range of visualization options, significantly enhancing market trend analysis capabilities and allowing them to adapt to different analytical needs and trading strategies.
To see a full list of what's new in v2.0, see our release notes.
LightningChart JS Trader is licensed per developer and is available as an annual license with 1 year support. See our LightningChart JS Trader licensing page for full details.
For more information, see our LightningChart JS Trader product page.
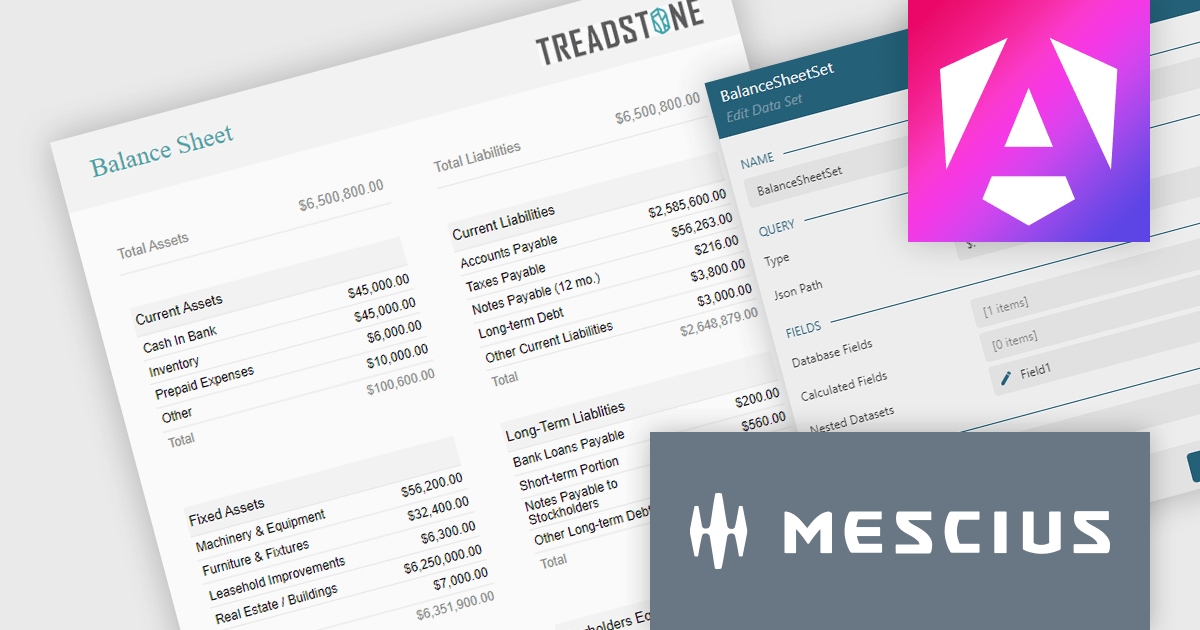
ActiveReportsJS is a powerful JavaScript reporting tool that allows developers and report authors to easily design and display reports within their web applications. With features such as drill-down, runtime data filtering, and interactive parameters, as well as compatibility with popular frameworks, ActiveReportsJS simplifies the process of creating and managing reports. Using the ActiveReportsJS Angular report designer component, many different types of data can be visualized, including financial reports (such as balance sheets) in a web application.
In this blog post, MESCIUS Technical Engagement Engineer Joel Parks shows you how to use the Angular Report Designer to design a balance sheet which can then be viewed in ActiveReportsJS's Angular Report Viewer. Steps include:
Read the full blog to get started using balance sheets to easily present a summary of a company's financial health and stability.
ActiveReportsJS is licensed on an annual subscription or perpetual basis and is available as a Single Deployment License for non-commercial use, and as a Single Domain License or Unlimited Domain License for commercial and/or SaaS use. See our ActiveReportsJS licensing page for full details.
For more information, visit our ActiveReportsJS product page.
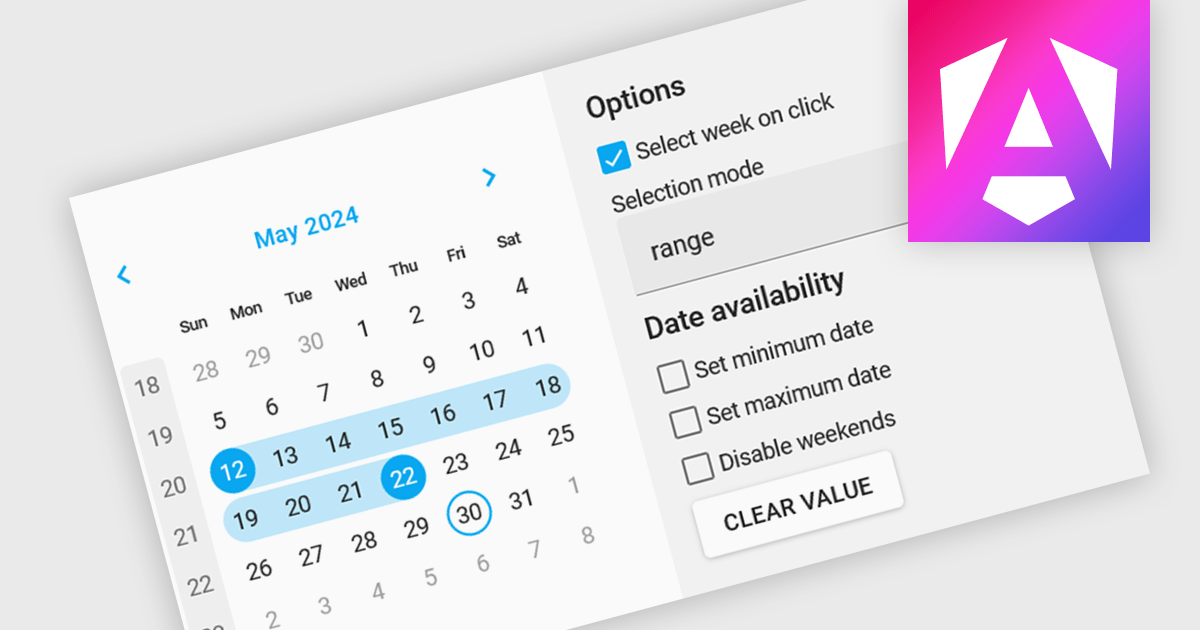
Calendar editing components provide a specialized way to interact with date and time data within the editor. These controls replace the standard input field with a visual calendar interface, allowing developers to offer a more intuitive and user-friendly experience for date selection and modification. This can significantly improve data entry accuracy and efficiency, especially when dealing with large datasets or complex date formats.
Several Angular data editor collections offer calendar editor controls including:
For an in-depth analysis of features and price, visit our Angular Data Editors comparison.

A checkbox data editor is a specific user interface element designed to efficiently manage boolean data (true/false values). It provides a clear and intuitive way for users to edit single binary flags within their data, improving data entry accuracy and streamlining the process compared to manually manipulating text fields. This boosts the user experience by allowing for quick choices, particularly when dealing with features like filtering preferences, selecting multiple items from a list, or toggling settings.
Several Vue.js components offer checkbox data editors, including:
For an in-depth analysis of features and price, visit our comparison of Vue.js data editors.


Tel: (888) 850 9911
Fax: +1 770 250 6199


