


Fornitore ufficiale
In qualità di distributori ufficiali e autorizzati, forniamo licenze software legittime direttamente da più di 200 autori di software.
Vedi tutte le nostre marche
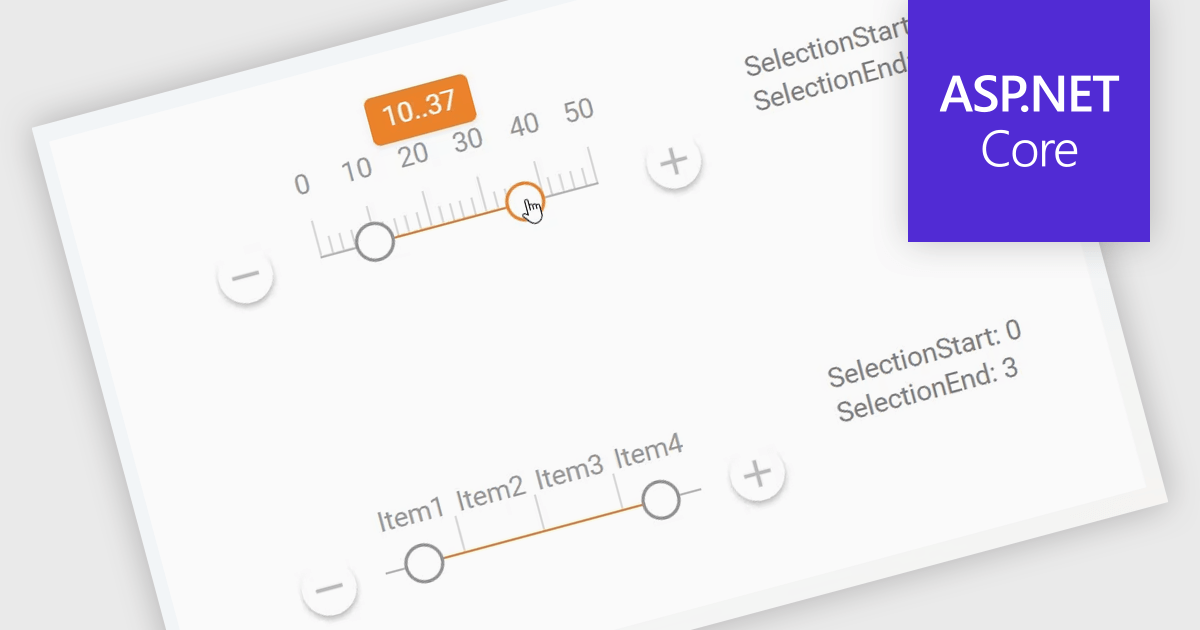
A Range Trackbar in ASP.NET Core Data Editor controls is an interactive input component that lets users select a numeric range by moving two handles along a track, rather than typing minimum and maximum values into separate fields. This makes range-based data entry faster, clearer, and less error-prone, especially when the valid values are bounded, such as prices, dates, percentages, ratings, quantities, or performance thresholds. For developers, it provides a more intuitive way to capture structured range input while maintaining control over validation, step intervals, formatting, and default values. In real-world applications, a Range Trackbar can be used in product filters to select a price range, reporting dashboards to define a date or score interval, booking systems to choose acceptable time windows, analytics tools to adjust threshold limits, or administrative forms where users need to configure minimum and maximum values without manually entering exact numbers.
Many ASP.NET Core Assembly Data Editors collections contain Range Trackbar controls including:
For an in-depth analysis of features and price, visit our comparison of ASP.NET Core Assembly Data Editors.
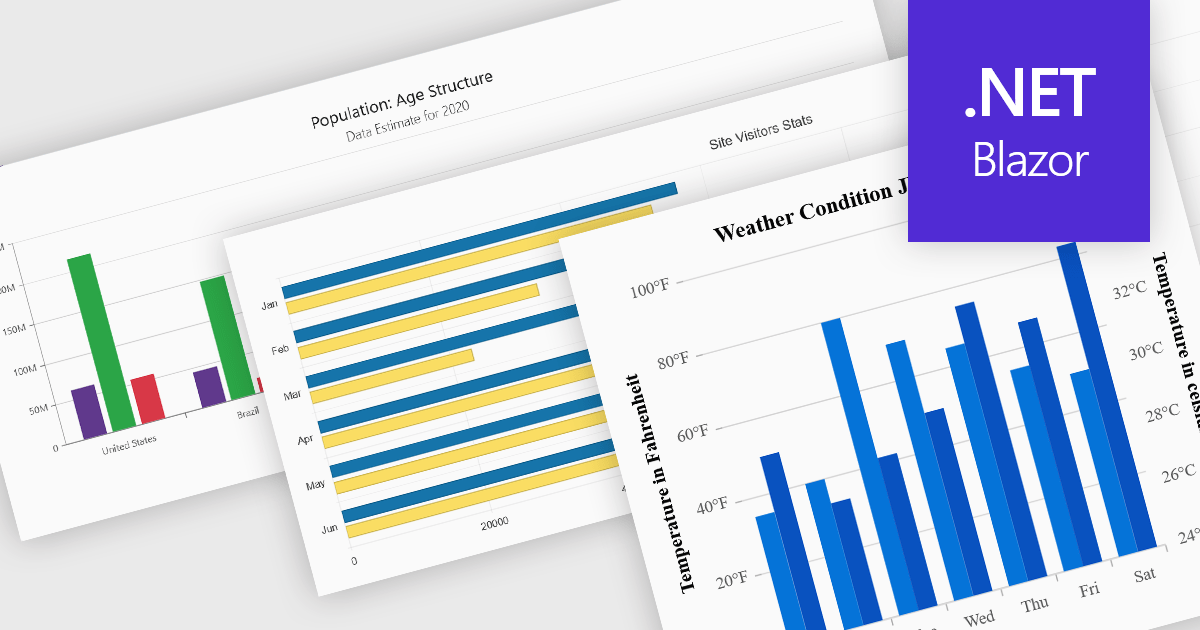
Column and bar charts are among the most widely used data visualization features in modern charting components, helping developers present comparisons, trends, and category-based metrics in a format that is easy to interpret. By displaying values as horizontal or vertical bars, these chart types allow applications to communicate changes in performance, rankings, distributions, and other business data with clarity. Modern charting components typically support customization options such as stacked series, grouped categories, animations, tooltips, responsive layouts, and interactive behaviors, enabling developers to create dashboards and reporting experiences that suit a wide range of enterprise and analytical scenarios.
Several Blazor chart controls offer column and bar charts including:
For an in-depth analysis of features and price, visit our Blazor chart controls comparison.
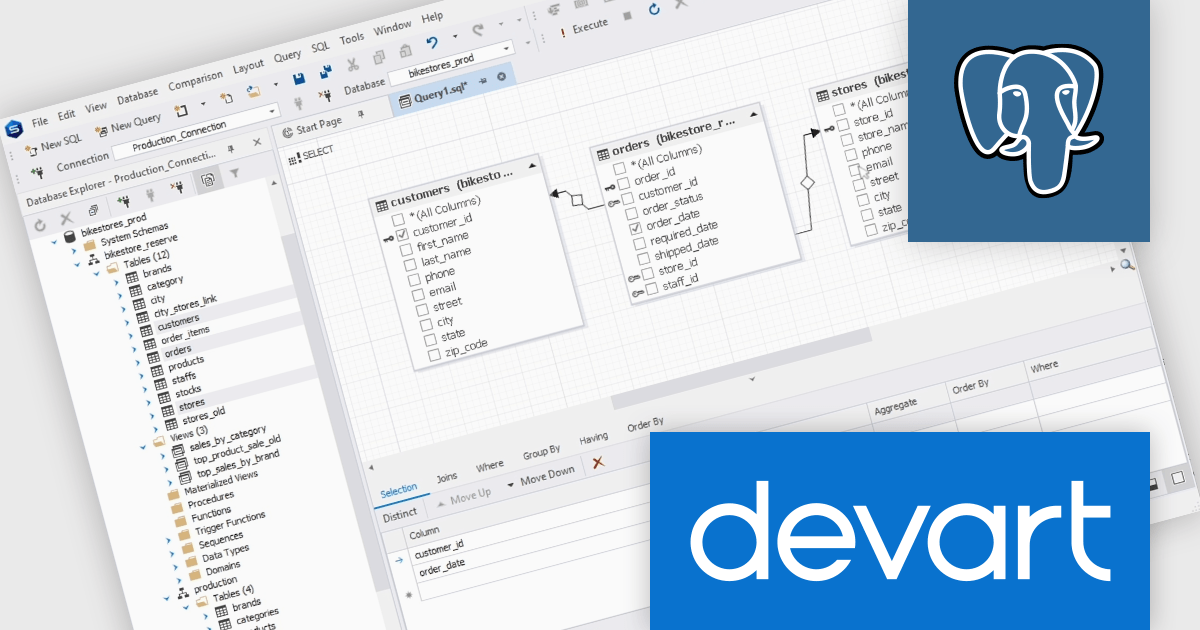
dbForge Studio for PostgreSQL by Devart is a comprehensive IDE (Integrated Development Environment) designed to simplify database management, development, and administration for PostgreSQL users. It provides a user-friendly interface and a robust set of tools for tasks such as SQL editing, query building, data import/export, and schema comparison. Key features include an advanced code editor with syntax highlighting, a visual query builder, and database synchronization tools, making it easier to optimize workflows and ensure data integrity. Ideal for developers, database administrators, and analysts, it streamlines complex processes, enhances productivity, and supports efficient database management across various use cases, from small-scale projects to enterprise-level solutions.
The dbForge Studio for PostgreSQL V2026.1 release adds a new fully-fledged visual Query builder making it easier to create and refine complex SQL queries through an intuitive graphical interface. By allowing users to visually design joins, filters, sorting, and query structures without relying entirely on manual coding, the feature helps reduce errors, speeds up query development, and makes advanced SQL more accessible to a broader range of users. It also provides a clearer view of query logic and relationships, which can simplify troubleshooting, and support faster database analysis and reporting workflows.
To see a full list of what's new in V2026.1 see our release notes.
dbForge Studio for PostgreSQL is licensed per developer and is available as an Annual or Perpetual License with a 12 month support and maintenance subscription. See our dbForge Studio for PostgreSQL licensing page for full details.
dbForge Studio for PostgreSQL is available individually or as part of dbForge Edge.
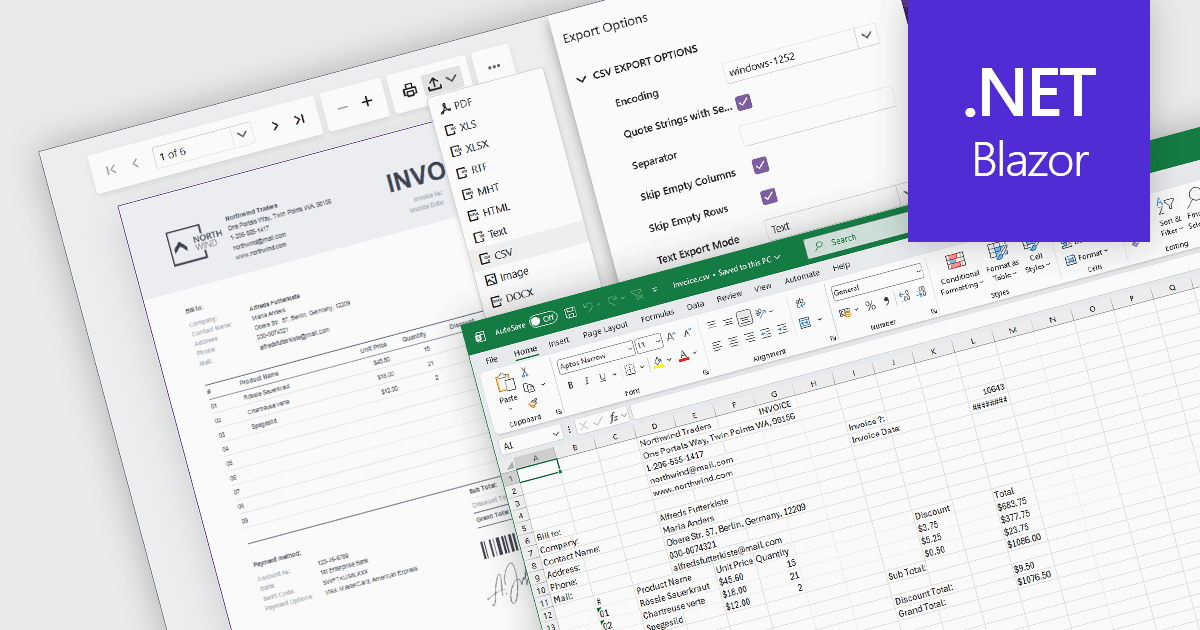
Exporting reports to CSV (Comma-Separated Values) format provides a simple and widely compatible way to transfer report data into spreadsheet applications, databases, analytics platforms, and other business systems. CSV files store structured data as plain text, making them easy to process, automate, archive, and exchange across different environments. For software developers and business users, CSV export functionality supports data analysis, operational reporting, integration workflows, and data retention requirements while maintaining low file complexity and broad platform support.
Several Blazor reporting components allow you to export to CSV, including:
For an in-depth analysis of features and price, visit our comparison of Blazor reporting components.
Smart UI by Smart HTML Elements is an enterprise-grade UI library offering pre-built web components for developers in Angular, React, Vue, Blazor, and JavaScript. It boasts over 60 ready-to-use components like grids, charts, schedulers, and editors, all featuring two-way data binding, responsiveness, accessibility, and theming capabilities. This library helps developers rapidly build dynamic and modern web applications with consistent look-and-feel and rich functionalities, accelerating development time and ensuring professional quality.
The Smart UI v26.0.0 update introduces native Data Grid cell comments, enabling software developers to build more collaborative applications with contextual feedback and data annotations directly within tabular interfaces. This feature improves communication during data reviews, validation workflows, and approval processes by allowing users to attach comments to specific cells without relying on external tools or custom implementations.
To see a full list of what's new in v26.0.0, see our release notes.
Smart UI (Smart HTML Elements) is licensed per developer and is available as a perpetual license with 1 year support and maintenance. It includes distribution to unlimited Web applications, SaaS projects, Intranets and Websites. Team, OEM and Enterprise licensing options are also available. See our Smart UI (Smart HTML Elements) licensing page for full details.
Learn more on our Smart UI (Smart HTML Elements) product page.


Tel: (888) 850 9911
Fax: +1 770 250 6199


