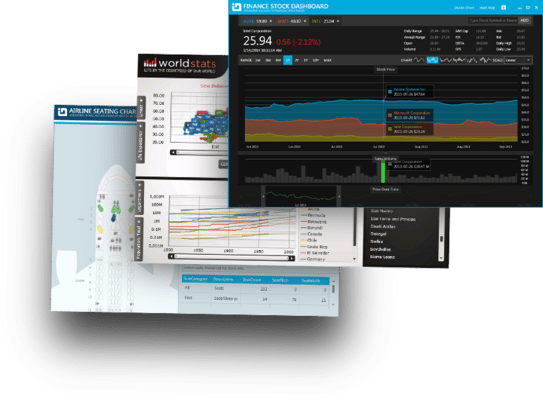
Infragistics NetAdvantage for WPF adds Metro Style

Released: May 10, 2012

Updates in this release

Updates in 2012 Volume 1

  • Metro Style - Optimized for touch and touch targets
  • Gesture Support - Give your end users consistent interactions when moving between tablet and desktop experiences
  • Color Tuner - Style your entire application with just a few clicks of your mouse. You can easily apply themes throughout your application, color-tune a theme without writing any XAML code, and save/share your favorite color configurations for later use
  • Undo/Redo Framework - Provides the infrastructure for supporting unlimited linear Undo/Redo functionality
  • Undo/Redo History Stacks - The collections raise change notifications and therefore may be used as a source for providing a UI that displays the entries in the history stacks
  • ObservableCollectionWithUndo - The framework includes a derived ObservableCollection that makes it easier to add support for undo/redo of collection changes
  • Transactions - Provides the ability to group one or more operations into a single history entry. One may also rollback a transaction performing the operations that were stored up to that point
  • Commands - A number of built in commands are provided to make it easier to invoke an Undo/Redo operation from within your UI
  • Geographic Map - The rich thematic mapping solution allows you to visualize your geographic data in multiple ways
  • Sparkline Charts - Render highly visual charts within limited spaces, such as a grid cell
  • Pivot Grid - Give your users the analytical advantage with new filtering, dropdown, and summarizing capabilities
  • Bar Code - Added a property to hide the Human Readable text
  • Ribbon - Let your end users customize tabs, groups and items to give them complete control over the application's user experience
  • Get Cell Text - Determine the text that would be displayed in Microsoft Excel cell given the cell’s value, format string, column width and worksheet options
  • Data Visualization and Line of Business Toolsets - Get over 50 types of charts, graphs, and gauges to make meaning of your business data
  • Motion Framework - Aimate your data over time, choreographing movements based on how you've decided to visualize their data
  • Org Chart - Create high performance, stylable organization charts that represent company, department, workgroup or other hierarchical structures
  • Network Node - Create visual representations of simple or complex network relationships
  • Timeline - Empower users to quickly understand and visualize a sequence of events
  • Treemap - Show the relative weight of data points at more than one level with no drilldown required
  • Zoombar - Provide end users with a pan and zoom user interface that allows them to intuitively scroll through a range of data with dynamically adaptive scaling