TeeChart .NET for Blazor
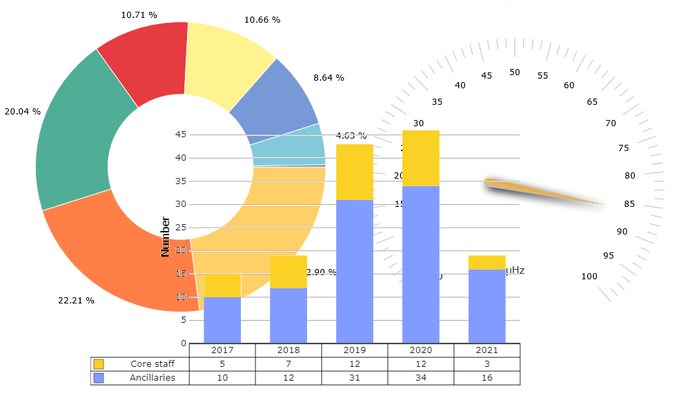
Grafici, mappe e contatori interattivi per ambienti desktop e per dispositivi mobili.
Pubblicato da Steema Software
Distribuito da ComponentSource dal 1998
Prezzi da: $ 175.42 Versione: 2023 Aggiornato il: Aug 31, 2023
Grafici, mappe e contatori interattivi per ambienti desktop e per dispositivi mobili.
Pubblicato da Steema Software
Distribuito da ComponentSource dal 1998
Prezzi da: $ 175.42 Versione: 2023 Aggiornato il: Aug 31, 2023

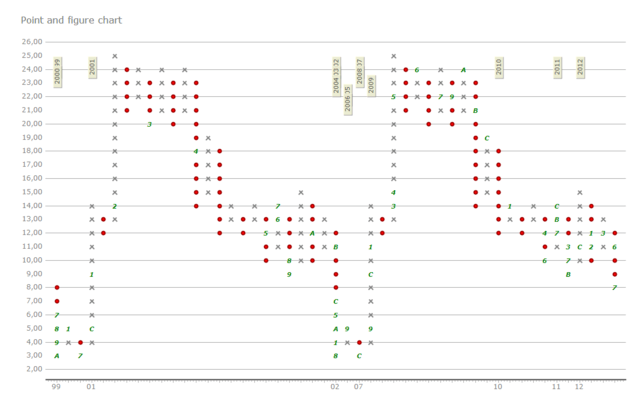
The Blazor Chart component is packed with functionality to produce high-class financial charting applications. Includes over 50 financial and statistical indicators such as Moving Average Convergence/Divergence (MACD), Average True Range (ATR), Commodity Channel Index (CCI), Relative Strength Index (RSI), Bollinger Bands, Standard Deviation and much more to visualize data in financial-based apps.


In qualità di distributori ufficiali e autorizzati, forniamo licenze software legittime direttamente da più di 200 autori di software.
Vedi tutte le nostre marche
Hai bisogno di aiuto per trovare la giusta licenza software, aggiornamento o rinnovo?
Chiama, Email o usa Live Chat con i nostri esperti.
Oltre 1.400.000 licenze distribuite a sviluppatori, amministratori di sistema, società, governi e rivenditori in tutto il mondo.
Per saperne di più su di noi.
Tel: (888) 850 9911
Fax: +1 770 250 6199
