Fornitore ufficiale
In qualità di distributori ufficiali e autorizzati, forniamo licenze software legittime direttamente da più di 200 autori di software.
Vedi tutte le nostre marche

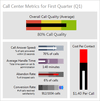
Schermate: A bullet graph is a special kind of bar chart used to display a single value in a context of one ... Per saperne di più Visualizza altri risultati di questo prodotto
Descrizione: graphs that render a measure within the context of other measures. Candlestick charts that show price ... Small charts, also called sparklines, designed to visualize complex data. Actipro Micro Charts ... for Silverlight visualize quantitative data and are designed to render clearly in compact spaces. Many chart types ... Per saperne di più
Note di rilascio: Fixed a bug where using aggregation with certain data point types like UInt32 could trigger an exception. ... Per saperne di più

Note di rilascio: Updates in 2012.2 Bullet Graph- A bullet graph is a special kind of bar chart used to display ... a single value and make comparisons to one or more related values. Box Plot- A box plot is a chart used ... Candlestick Chart- Candlestick charts are used to visualize price movements over time, such as changing stock ... Per saperne di più Visualizza altri risultati di questo prodotto
Testimonianza clienti: Great control visuals, immersive API’s, detailed samples, and excellent support! Boyd Patterson, ... Per saperne di più
Descrizione: Actipro Charts for WPF Actipro Charts is a set of full-sized charts that provide rich visualization ... for quantitative data. It's designed to make even the most complex data easily readable. Many chart types ... are supported, from basic line and bar charts to stacked area charts. The chart control includes numerous useful ... Per saperne di più

Descrizione: Full-featured charts for visualizing data. Actipro Charts for Silverlight is a set of full-sized ... charts that provide rich visualization for quantitative data. It's designed to make even the most ... complex data easily readable. Many chart types are supported, from basic line and bar charts to stacked ... Per saperne di più Visualizza altri risultati di questo prodotto
Note di rilascio: to supply pie slice tooltips. Updated stacked charts to show each data point's actual value ... in the label instead of the stacked value. Fixed a rendering bug when plotting charts for a single date/time ... Per saperne di più
Note di rilascio: Updates bar charts to pass the XYDataPoint as data context into the BarTemplate. Updated bar ... charts to pass the XYDataPoint as data context into the BarTemplate. ... Per saperne di più

Note di rilascio: Updates in 2013.2 Pie Chart- Supports multiple label positioning and display options, legend ... display, nesting of multiple series and hierarchical data. Donut Chart- Supports multiple label positioning ... configuration. Percentage Stacking Chart- When using stacking bar or area charts with the percentage axis option, ... Per saperne di più Visualizza altri risultati di questo prodotto
Note di rilascio: Updates in 2014.2 Six new built-in chart palette options, including Retro and Sand. Updated ... Per saperne di più
Note di rilascio: the background of the line terminator's virtual character. Charts- Create stunning line, scatter, area ... and bar charts in your apps. Code Indicators- Built-in indicators include bookmarks, breakpoints ... Per saperne di più