Fornitore ufficiale
In qualità di distributori ufficiali e autorizzati, forniamo licenze software legittime direttamente da più di 200 autori di software.
Vedi tutte le nostre marche
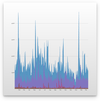
Descrizione: Add line and area charts to your JavaScript apps. Vizuly Line Area Chart supports both line and area plots in several different layout options. It also comes bundled with a test container demonstrating the various chart properties and different style ... Per saperne di più
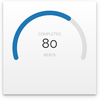
Descrizione: Show numeric values within a minimum and maximum range. Vizuly Radial Progress is designed to show numeric values within a minimum and maximum range. It can also show when a value has exceeded the maximum threshold. This chart supports a variable range of ... Per saperne di più
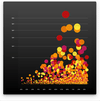
Descrizione: Add Scatter Plot charts to your JavaScript apps. Vizuly Scatter Plot shows 3 dimensions of data at once by plotting values along both the x and y axis as well as the radius of the plot itself. Each plot can be colored and styled dynamically based on your ... Per saperne di più
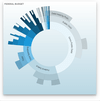
Descrizione: Adds Sunburst charts to your JavaScript apps. Vizuly Sunburst is designed to represent hierarchical data in a radial plot. It supports drill down and drill up capabilities by allowing the user to collapse and expand segments of the sunburst when they ... Per saperne di più
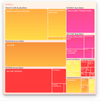
Descrizione: Add Tree Map charts to your JavaScript apps. Vizuly Tree Map visualizes hierarchical data in nested rectangular plots where the area of each rectangle is bound to a data property you can set. This TreeMap also supports the ability to drill down/up, in ... Per saperne di più
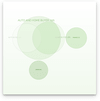
Descrizione: Add Venn Diagram charts to your JavaScript apps. Vizuly Venn Diagram shows all possible logical relations between a finite collection of different sets. This chart depicts elements as points in the plane, and sets as regions inside closed curves. A Venn ... Per saperne di più

Descrizione: Add Word Clouds to your JavaScript apps. Vizuly Word Cloud is a unique way to represent the occurrence rate of words within a given text stream. This visualization supports an exclusion list that will ignore common pronouns, profanity, or any words you ... Per saperne di più

Descrizione: Build responsive, interactive JavaScript data grids and tables with minimal set-up. ZingGrid is a JavaScript Web Component Library that allows developers to include interactive data tables in their web applications. The library can also be used in popular ... Per saperne di più

Descrizione: The no-nonsense super fast JavaScript Excel-like data table. DataGridXL provides a Microsoft Excel-like experience for Web Apps. DataGridXL is a performant data grid, written in JavaScript ES6 with performance and usability in mind. DataGridXL is just ... Per saperne di più

Descrizione: Flexible and interactive Gantt charts for your JavaScript application. ScheduleJS is a JavaScript library that was created to help you design flexible scheduling applications. Handling massive amounts of data with ease, ScheduleJS will help you raise the ... Per saperne di più