Blazor용 UI - 모든 요구 사항을 충족할 수 있는 고성능 Grid 및 사용자 지정이 쉬운 기본 UI 구성 요소를 사용하여, Blazor 응용프로그램을 절반의 기간에 개발하십시오. 개발 주기 단축, 빠른 반복 및 출시 시간 단축을 경험할 수 있도록 처음부터 구축되었습니다.
빠르고 강력한 그리드 구성 요소 - 테이블 형식의 데이터를 표시하기 위한 유용한 기능이 풍부한 구성 요소입니다. 다양한 기능에는 데이터 바인딩, 편집, Excel과 같은 필터링, 사용자 지정 정렬, 행 집계, 셀렉션 그리고 Excel, CSV 및 PDF 형식에 대한 지원이 포함됩니다.
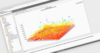
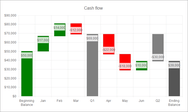
JavaScript charts designed to be embedded and integrated.
Exporting and Sharing - You can easily share charts to social networks including Facebook, Twitter, Pinterest and LinkedIn. You can also save charts as an image in PDF, PNG, JPG or SVG formats.
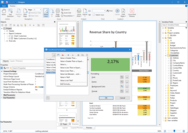
600개 이상의 UI 컨트롤, DevExpress Dashboard, eXpressApp Framework 등을 포함합니다.
자바스크립트 피벗 그리드 (JavaScript Pivot Grid) - 다차원 데이터 분석에 최적화 된 풍부한 기능의 클라이언트측 위젯입니다. 다양한 런타임 사용자 지정 옵션 집합을 제공하여 사용자가 교차-테이블 표시 형식을 통해 비즈니스 동향을 신속하게 요약 할 수 있습니다.
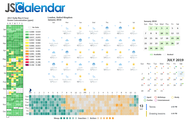
Blazor 컴포넌트 라이브러리 (Blazor Components Library) - DataGrid (편집, 그룹화 및 엑셀과 같은 필터링), Charts (라인에서 금융 차트에 이르는 30개 이상 차트 및 그래프) 및 Scheduler (세분화된 이벤트가 있는 단일 레이아웃에 여러 캘린더를 표시)를 포함하는 65개 이상의 UI 및 데이터 시각화.
.













 (5)
(5)




 (5)
(5)

