


공식 공급 업체
200 이상의 소프트웨어 개발처와 판매 계약을 맺은 공인 디스트리뷰터로서 합법적인 라이선스를 제공합니다.
모든 브랜드 보기.
영어로 계속 읽기:
Wijmo is a cross-platform UI JavaScript library that offers a comprehensive set of controls and tools for building rich, interactive web applications. Its components have zero dependencies and are written as lean TypeScript classes. Wijmo's key components include FlexGrid for data management, FlexChart for charting and data visualization, Input Controls for user input, and Report Viewer for creating and presenting reports.
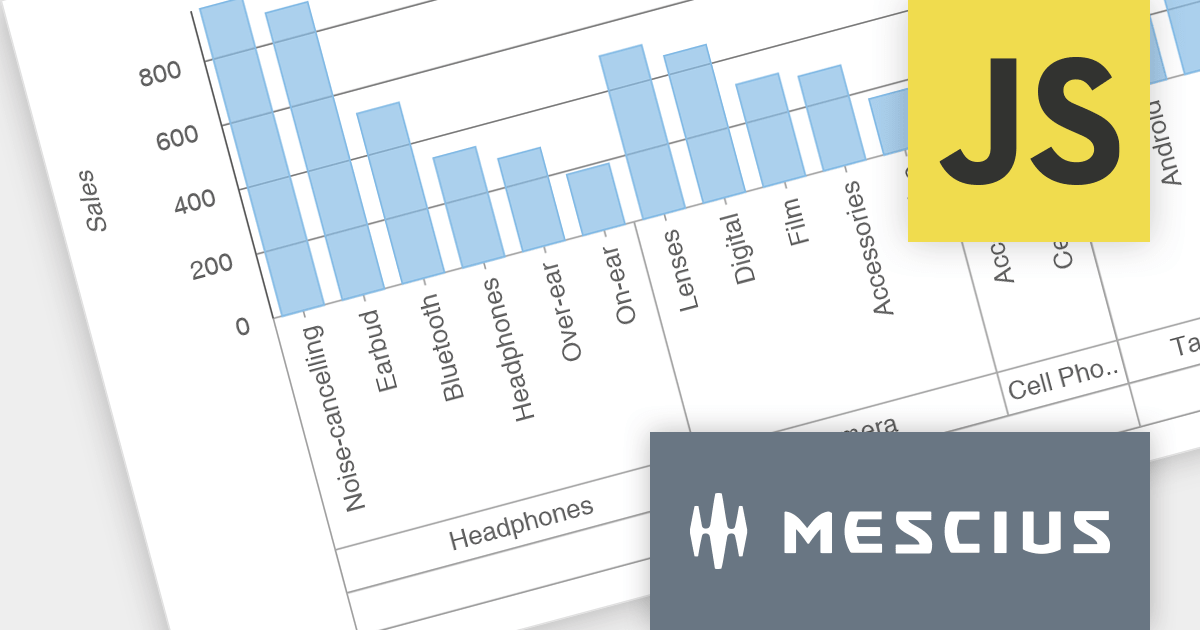
The Wijmo 2023 v2 release brings data grouping support to FlexChart. Axis grouping helps to organize complex data by visually separating it into categories or subcategories along the axis, making it easier to identify trends, patterns, and outliers within each group. While data grouping has long been a staple of Wijmo's CollectionView, users requested similar functionality in FlexChart, which MESCIUS has now incorporated. You can bind FlexChart to a grouped CollectionView and set the 'axis.groupsOptions' property to enable grouped labels in your charts.
To see a full list of what's new in version 2023 v2, see our release notes.
Wijmo is licensed per developer. Developer Licenses are perpetual and include 1 year Subscription which provides upgrades, including bug fixes and new features. See our Wijmo licensing page for full details.
For more information, visit our Wijmo product page.
전화 : 00798 14 800 6332
팩스 : +1 770 250 6199


