


공식 공급 업체
200 이상의 소프트웨어 개발처와 판매 계약을 맺은 공인 디스트리뷰터로서 합법적인 라이선스를 제공합니다.
모든 브랜드 보기.
영어로 계속 읽기:
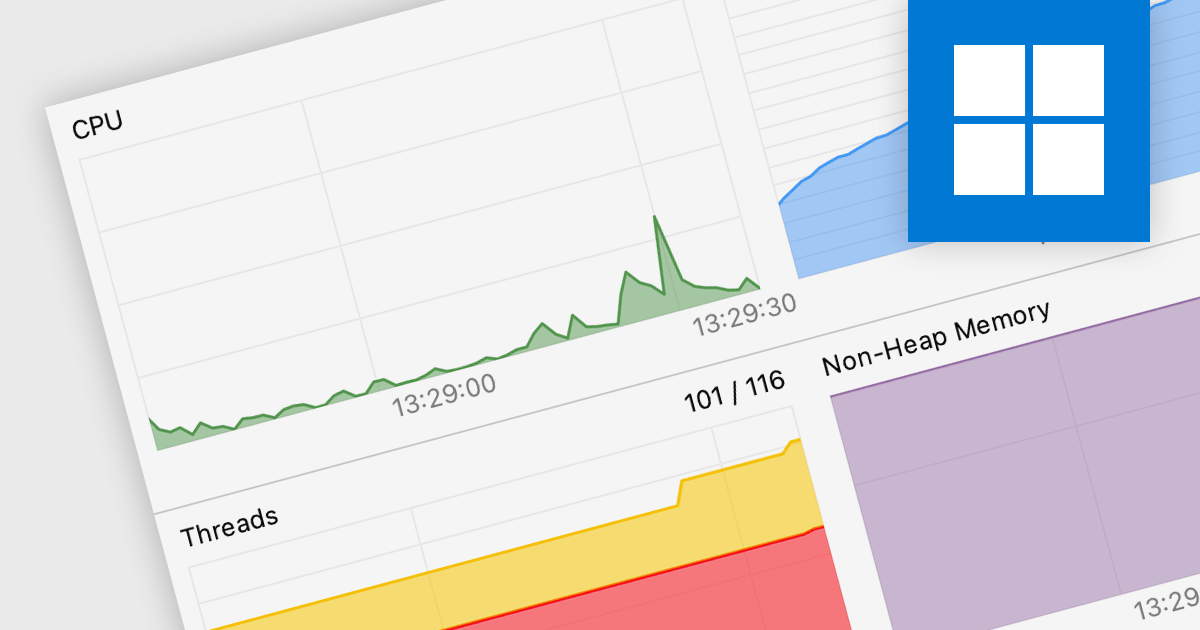
Code profiling is a diagnostic technique employed to analyze the runtime behavior of an application. It dissects resource consumption, usually including CPU time, memory allocation, and function call frequency, to precisely identify performance bottlenecks and resource hogs. Armed with these insights, developers can optimize specific code sections, leading to improved user experience, resource efficiency, and ultimately, a more robust and performant application.
Several IDEs support code profiling, including:
For an in-depth analysis of features and price, visit our IDEs comparison.
전화 : 00798 14 800 6332
팩스 : +1 770 250 6199


