


공식 공급 업체
200 이상의 소프트웨어 개발처와 판매 계약을 맺은 공인 디스트리뷰터로서 합법적인 라이선스를 제공합니다.
모든 브랜드 보기.
영어로 계속 읽기:
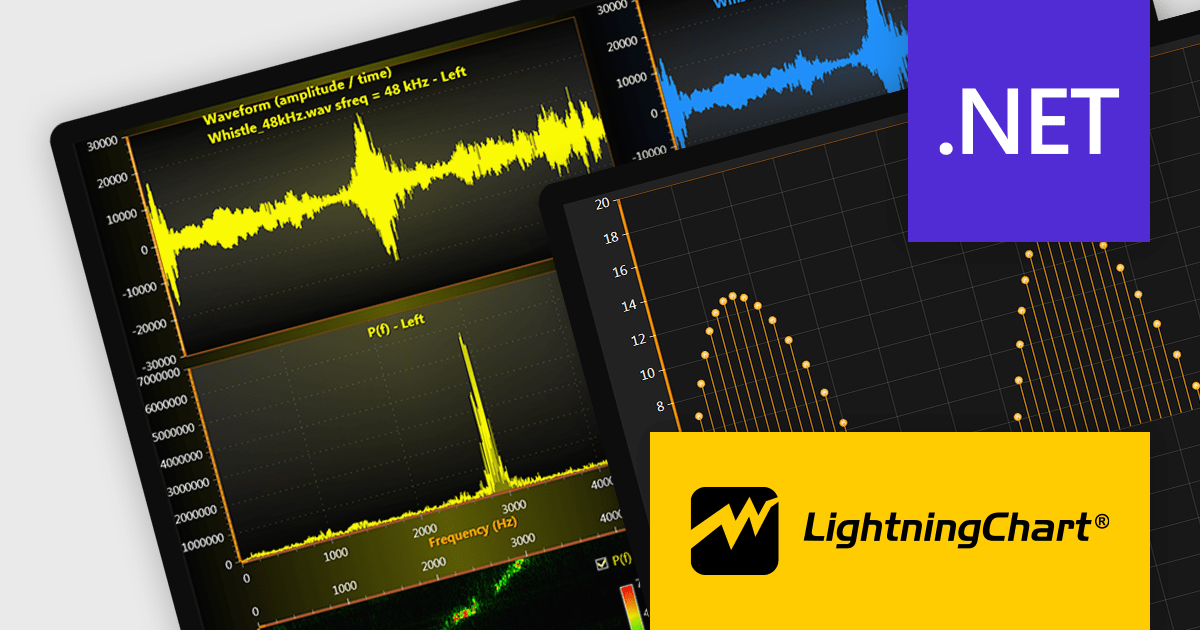
LightningChart .NET is a 2D and 3D data visualization SDK empowering developers with high-performance and flexibility. Boasting over 100 chart types, advanced technical indicators, and real-time rendering capabilities, it handles demanding scientific, financial, and engineering challenges, while its rich API and comprehensive support equip developers to craft informative and interactive dashboards.
The LightningChart .NET v11.0.1.1 release enhances text rendering fidelity in WinForms applications, ensuring exceptional clarity and readability across diverse screen resolutions and DPI configurations. This update guarantees a visually consistent and crisp user experience, independent of the user's device display characteristics. Additionally, it optimizes per-monitor DPI awareness for text rendering in both WinForms and WPF applications, particularly within the .NET 6 build environment. This refinement assures well-rendered and accurately scaled text across multiple monitors with varying DPI settings.
To see a full list of what's new in v11.0.1.1, see our release notes.
LightningChart .NET is available per developer in packages for either WPF, WinForms, UWP or all 3. Each package comes as a subscription license (with 1 or 2 years of limited support), or a perpetual license (with 1 or 2 years of Standard or Premium support). Floating licenses and site licenses are available upon request. See our LightningChart .NET licensing page for full details.
For more information, see our LightningChart .NET product page.
전화 : 00798 14 800 6332
팩스 : +1 770 250 6199


