


공식 공급 업체
200 이상의 소프트웨어 개발처와 판매 계약을 맺은 공인 디스트리뷰터로서 합법적인 라이선스를 제공합니다.
모든 브랜드 보기.
영어로 계속 읽기:
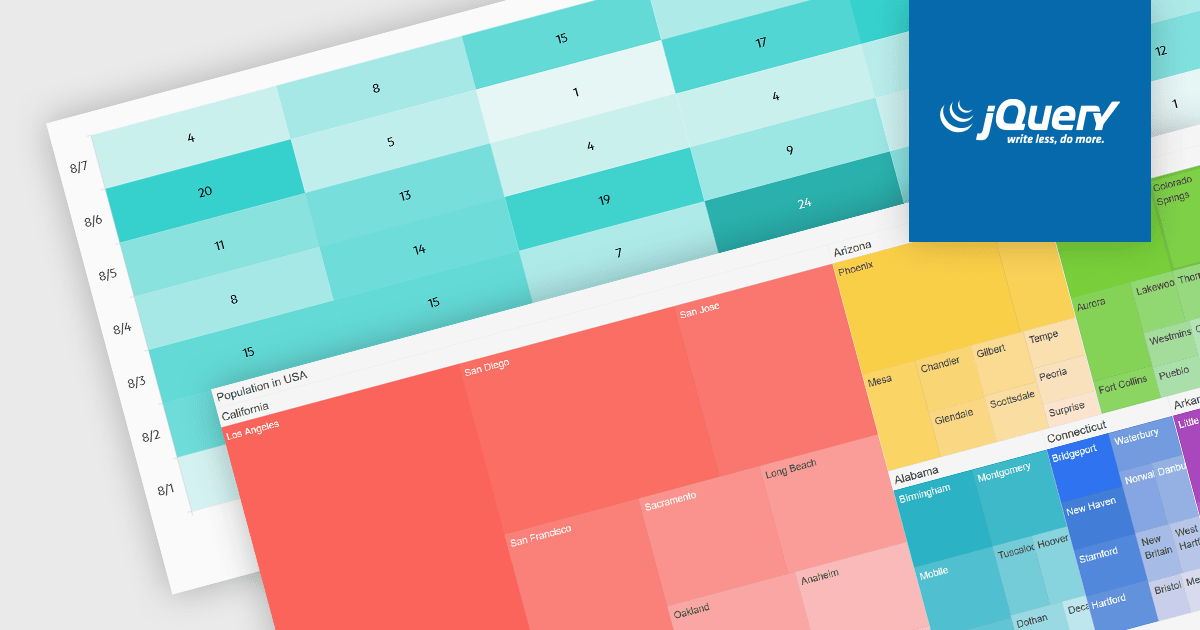
Heatmaps and treemaps are powerful data visualization tools that offer specific advantages when examining large datasets. A heatmap colorizes data values in a matrix, allowing for intuitive observation of trends, patterns, and outliers over two dimensions, making it helpful for spatial data analysis and correlation assessment. Treemaps exhibit hierarchical data as nested rectangles, with size and color variations indicating distinct quantitative values, allowing for effective use of space and fast comparison of proportions and relationships within hierarchical structures. Together, these chart types provide significant tools for visualizing and interpreting complex data, improving decision-making processes by presenting underlying data insights in a clear and actionable manner.
Several jQuery chart controls support the Heat and Treemap chart types, including:
For an in-depth analysis of features and price, visit our comparison of jQuery chart controls.
전화 : 00798 14 800 6332
팩스 : +1 770 250 6199


