


공식 공급 업체
200 이상의 소프트웨어 개발처와 판매 계약을 맺은 공인 디스트리뷰터로서 합법적인 라이선스를 제공합니다.
모든 브랜드 보기.
영어로 계속 읽기:
Infragistics Ultimate UI for Windows Forms and Infragistics Ultimate UI for WPF are comprehensive suites of UI controls designed to streamline development and enhance the user experience of desktop applications. Boasting over 100 components, they offer a rich set of functionalities, including data visualization tools, high-performance grids, and modern UI elements that mimic the look and feel of Microsoft Office. These feature-packed libraries empower developers to craft powerful, visually appealing applications with a consistent user experience.
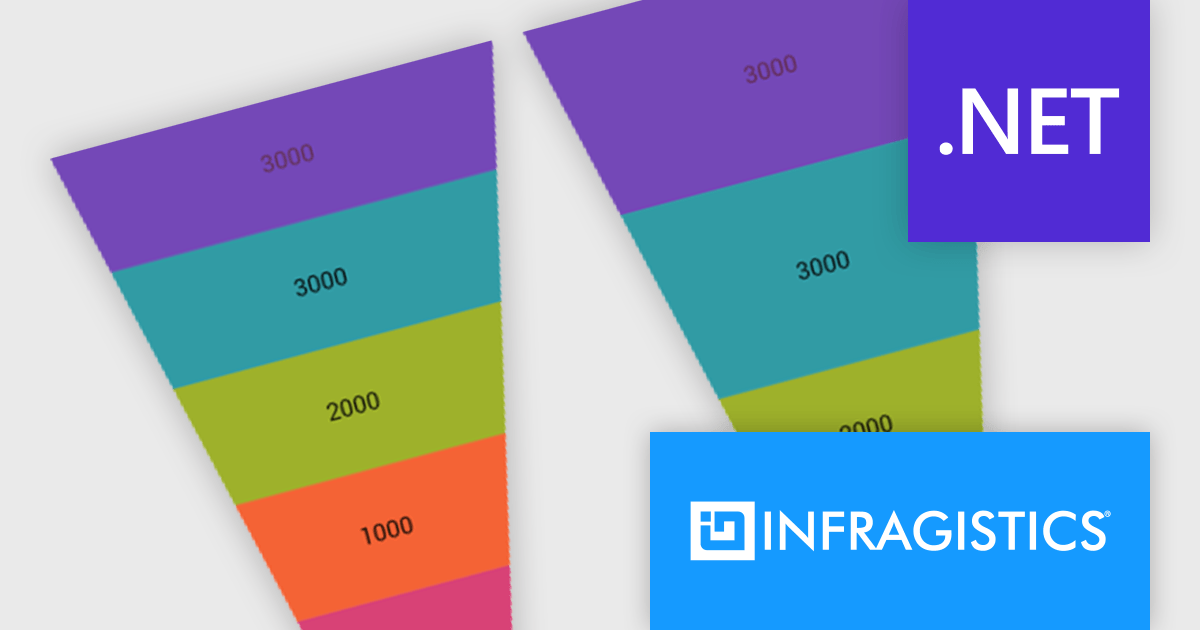
In the latest version, funnel charts can now display a special overlay to highlight specific sections. This highlighting feature allows you to compare the values of different stages in your funnel. You can also control the transparency of the overlay to emphasize the difference between the main data and the highlighted data.
To see a full list of what's new, see our release notes for Infragistics Ultimate UI for Windows Forms and Infragistics Ultimate UI for WPF.
Infragistics Ultimate UI for Windows Forms and Infragistics Ultimate UI for WPF are licensed per developer and are available as a Perpetual License with 1, 2 or 3 year support and maintenance subscription. See our Infragistics Ultimate UI for Windows Forms licensing page or Infragistics Ultimate UI for WPF licensing page for full details.
Infragistics Ultimate UI for Windows Forms is available to buy in the following products:
Infragistics Ultimate UI for WPF is available to buy in the following products:
전화 : 00798 14 800 6332
팩스 : +1 770 250 6199


