


공식 공급 업체
200 이상의 소프트웨어 개발처와 판매 계약을 맺은 공인 디스트리뷰터로서 합법적인 라이선스를 제공합니다.
모든 브랜드 보기.
영어로 계속 읽기:
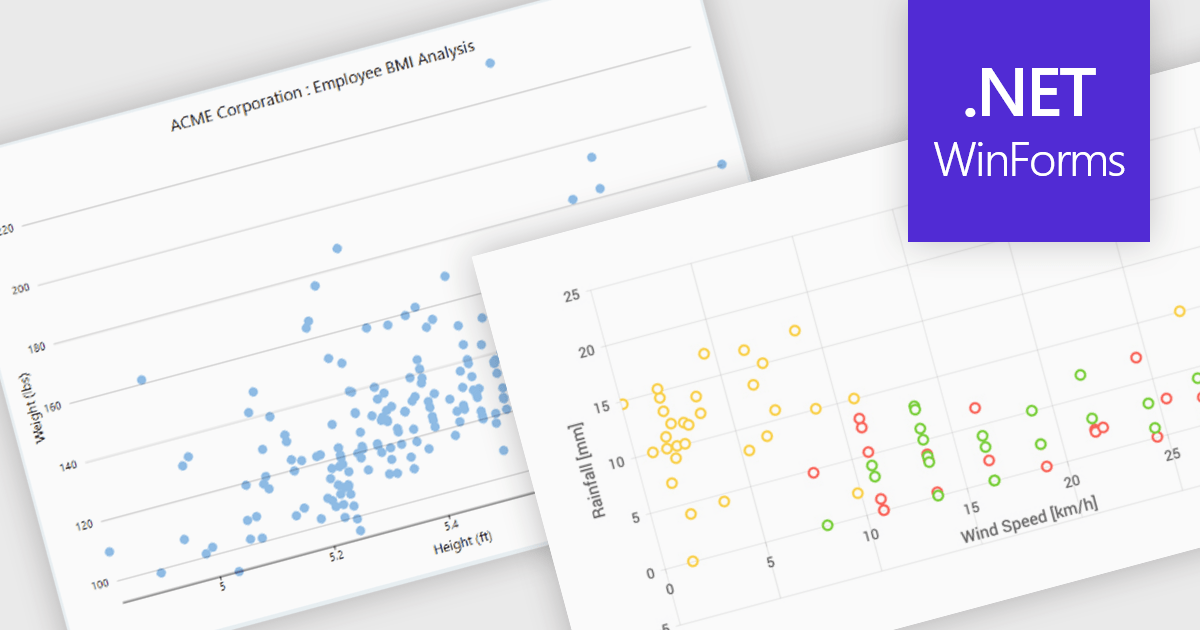
Scatter charts, also known as scatter plots or scatter diagrams, are fundamental visualization tools used to explore the relationship between two continuous variables by plotting data points, where each point's position is determined by its corresponding values for the two variables. This visual representation effectively reveals correlations and helps identify outliers, clusters, and the overall range and distribution of the data. The benefits of using scatter charts include their simplicity in conveying complex relationships, their ability to highlight anomalies that might be missed in tabular data, and their role as a precursor to more advanced statistical analyses like regression.
Several .NET WinForms chart controls offer scatter charts including:
For an in-depth analysis of features and price, visit our .NET WinForms chart controls comparison.
전화 : 00798 14 800 6332
팩스 : +1 770 250 6199


