


공식 공급 업체
200 이상의 소프트웨어 개발처와 판매 계약을 맺은 공인 디스트리뷰터로서 합법적인 라이선스를 제공합니다.
모든 브랜드 보기.
영어로 계속 읽기:
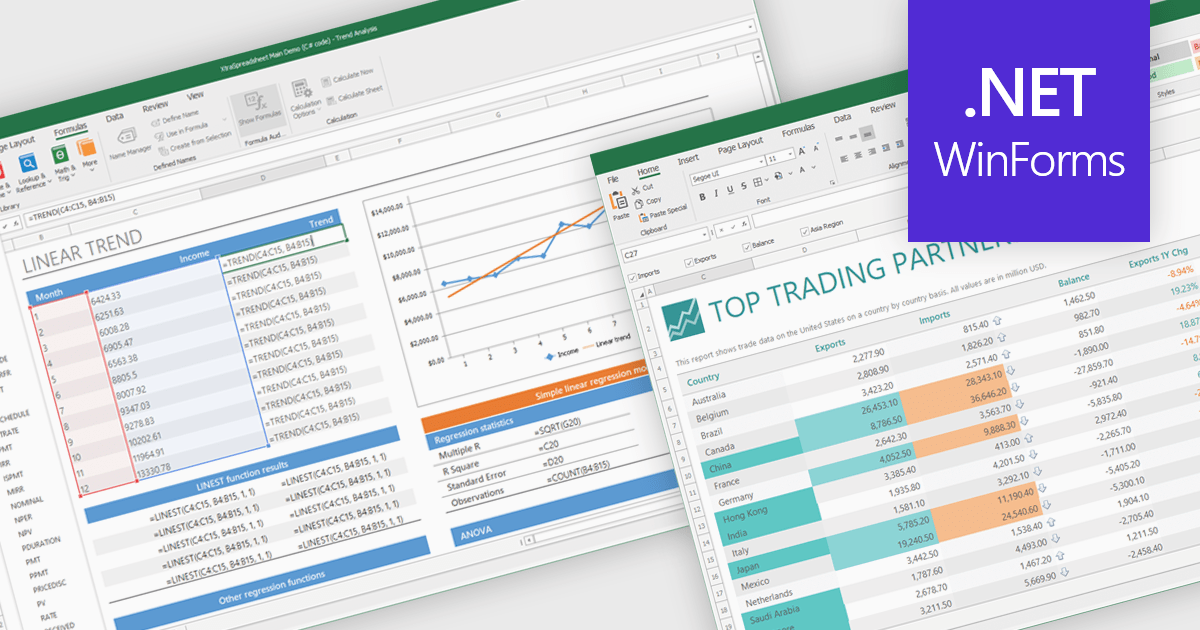
Chart support in a spreadsheet component refers to the ability to create, render, and manipulate various types of charts - such as line, bar, pie, and area charts - all within the spreadsheet environment. This functionality allows spreadsheet developers to present data visually and dynamically, without needing to rely on external charting libraries. The integration of charting capabilities enhances the end-user experience by making complex data more understandable. For developers, this reduces the need for separate visualization components, improves performance through tighter integration, and simplifies the deployment of data-centric applications.
Several .NET Winforms spreadsheet controls offer chart support, including:
For an in-depth analysis of features and price, visit our .NET Winforms spreadsheet controls comparison.
전화 : 00798 14 800 6332
팩스 : +1 770 250 6199


