


공식 공급 업체
200 이상의 소프트웨어 개발처와 판매 계약을 맺은 공인 디스트리뷰터로서 합법적인 라이선스를 제공합니다.
모든 브랜드 보기.
영어로 계속 읽기:
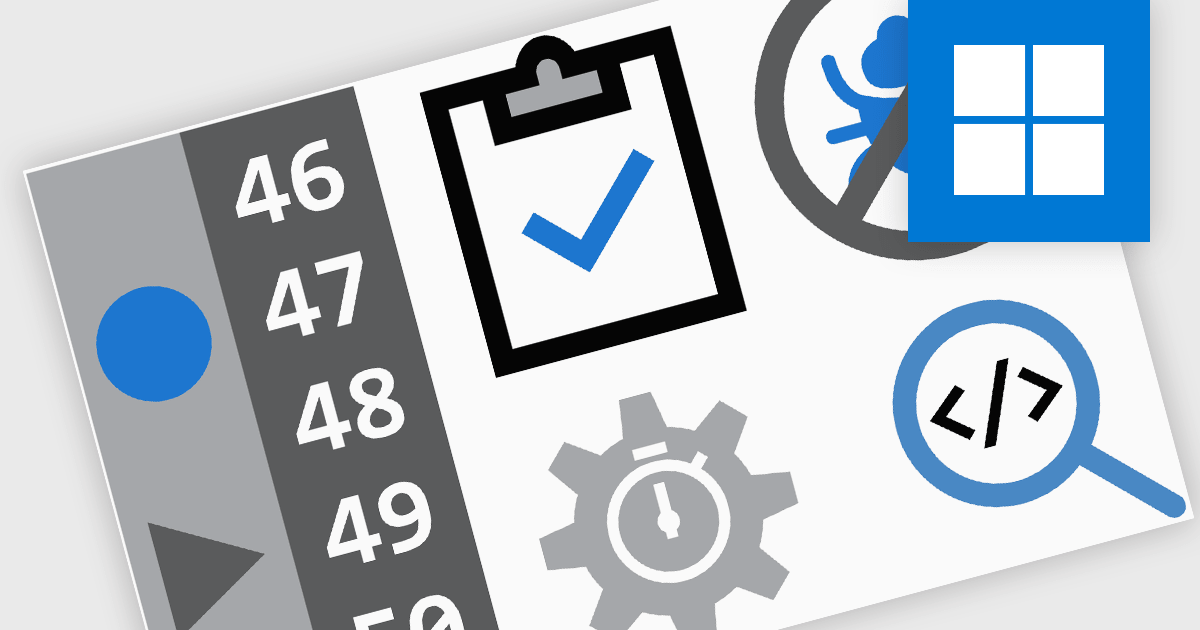
Debugging in an IDE (Integrated Development Environment) is the process of identifying, analyzing, and resolving errors or unintended behavior within code using the specialized tools provided by the environment. It allows developers to set breakpoints, inspect variable values, monitor memory usage, and control the execution flow of a program in real time, which facilitates a deeper understanding of how the code behaves under various conditions. This capability significantly accelerates problem resolution, improves code reliability, and enhances overall development efficiency by providing immediate feedback and precise control over the debugging process.
Common Debugging features include:
For an in-depth analysis of features and price, visit our Integrated Development Environments (IDEs) comparison.
전화 : 00798 14 800 6332
팩스 : +1 770 250 6199


