


공식 공급 업체
200 이상의 소프트웨어 개발처와 판매 계약을 맺은 공인 디스트리뷰터로서 합법적인 라이선스를 제공합니다.
모든 브랜드 보기.
영어로 계속 읽기:
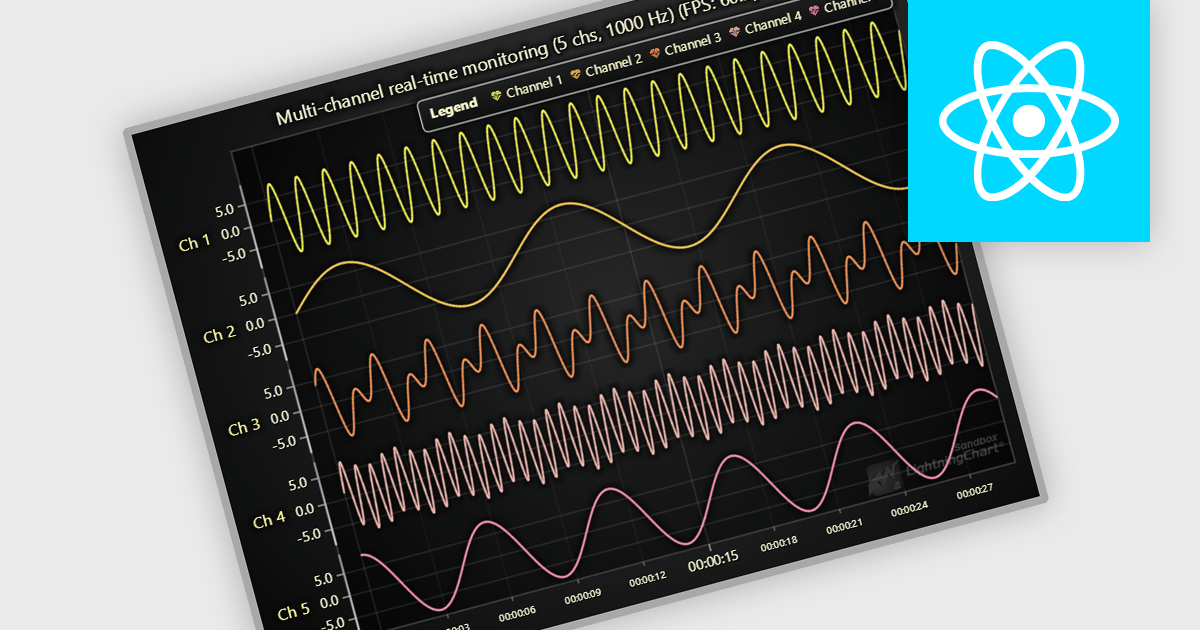
JavaScript API as a data source in React JavaScript Charts refers to the use of custom JavaScript functions or services that fetch and supply data dynamically to chart components at runtime, rather than relying on static datasets. This approach enables charts to reflect real-time data changes, support asynchronous operations, and integrate with external APIs or internal services. It is particularly useful for applications that require up-to-date information, such as dashboards, monitoring tools, or analytics platforms. The key advantage is enhanced flexibility and responsiveness, allowing developers to handle complex data flows, perform live updates, and tailor chart behavior based on interactive or conditional logic.
Several React Chart Controls offer support for using JavaScript API as a data source including:
For an in-depth analysis of features and price, visit our comparison of React Chart Controls.
전화 : 00798 14 800 6332
팩스 : +1 770 250 6199


