













공식 공급 업체
200 이상의 소프트웨어 개발처와 판매 계약을 맺은 공인 디스트리뷰터로서 합법적인 라이선스를 제공합니다.
모든 브랜드 보기.
Syncfusion Essential Studio Enterprise provides a comprehensive collection of UI components and frameworks for building modern cross-platform applications. It offers over 1,800 components compatible with .NET WinForms, WPF, ASP.NET Core & MVC, WinUI, MAUI, JavaScript, Blazor, and more, enabling seamless application development across diverse devices and operating systems.
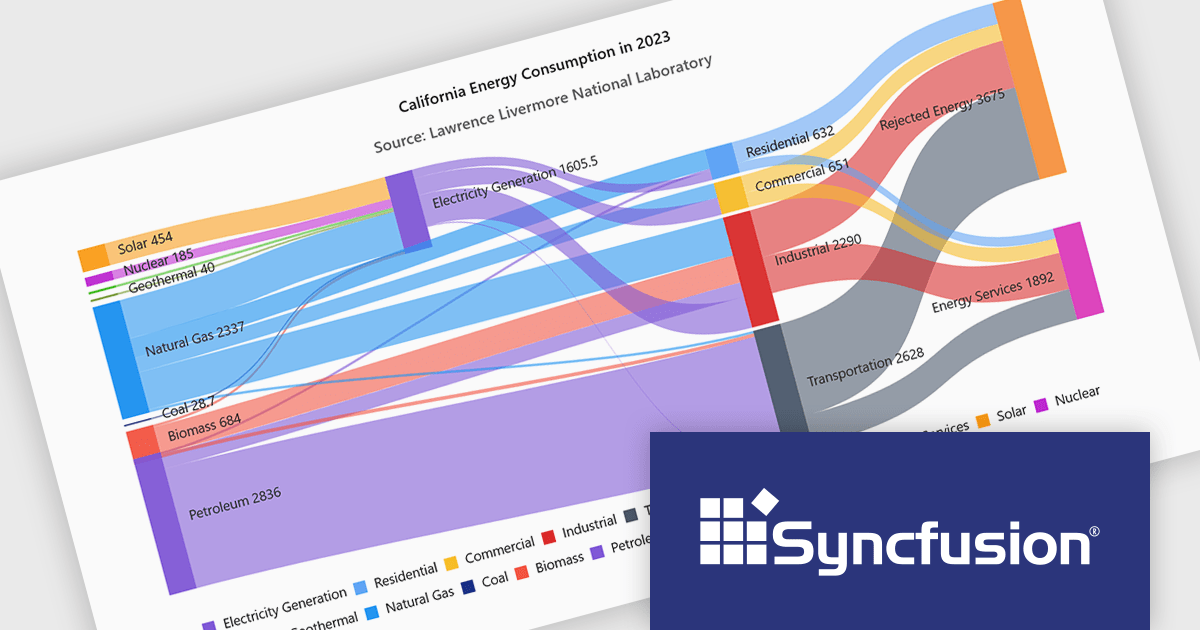
Syncfusion Essential Studio extends Sankey Diagram support to JavaScript, enabling developers to visualize the movement of quantities and relationships within complex systems through interconnected nodes and weighted links. This helps applications present complex data flows more clearly, making it easier for users to understand how values move and transform across stages, identify patterns and dependencies, and gain meaningful insights from interconnected datasets.
Syncfusion Essential Studio Enterprise is licensed per developer and is available as a 12 Month Timed Subscription License which includes support and maintenance. See our Syncfusion Essential Studio Enterprise licensing page for full details.
Learn more on our Syncfusion Essential Studio Enterprise product page.
jQWidgets is a comprehensive JavaScript UI framework offering a robust collection of over 60 widgets, themes, and utilities for building professional-grade, cross-platform web applications. Built on jQuery, HTML5, and CSS, it provides extensive functionality including data grids, charts, navigation, input validation, and more. jQWidgets simplifies web development, ensuring your applications work seamlessly across desktop browsers, tablets, and smartphones.
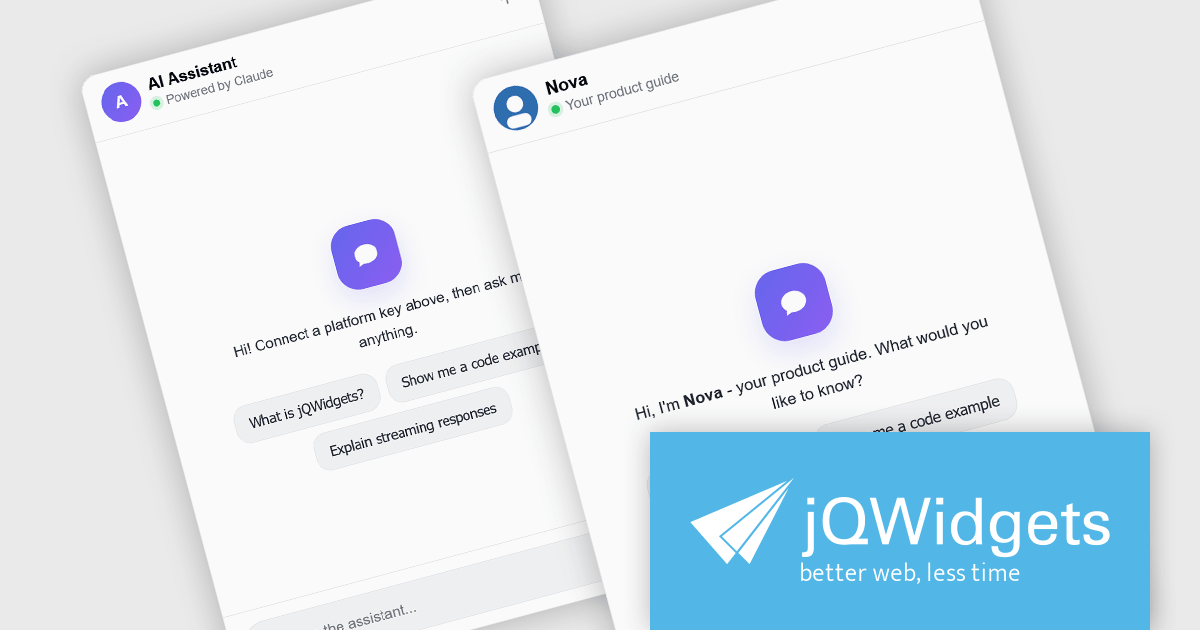
The jQWidgets v26.0.0 release includes a new jqxChat widget which adds conversational capabilities to web applications by providing a ready-to-use interface for real-time messaging and AI-assisted interactions. It supports rich message content, customizable appearance, and flexible integration with backend services and large language model (LLM) providers, making it suitable for customer support, virtual assistants, collaboration tools, and internal business applications. By incorporating jqxChat, developers can add engaging conversational experiences without building a chat interface from scratch, while maintaining the same look, feel, and development approach as the rest of the jQWidgets component library.
To see a full list of what's new in v26.0.0, see our release notes.
jQWidgets is licensed per developer and is available as a Perpetual license 1 year support and maintenance. See our jQWidgets licensing page for full details.
Learn more on our jQWidgets product page.
LightningChart JS Trader is a JavaScript/TypeScript library developed by LightningChart that specifically targets the creation of financial and trading applications. It provides high-performance, 2D, 3D, and real-time charting controls and a comprehensive suite of visualizations including candlestick, bar, line, and various technical indicators and drawing tools. This library enables software developers to create interactive technical analysis tools without the need for server-side setup as it runs completely on the client device.
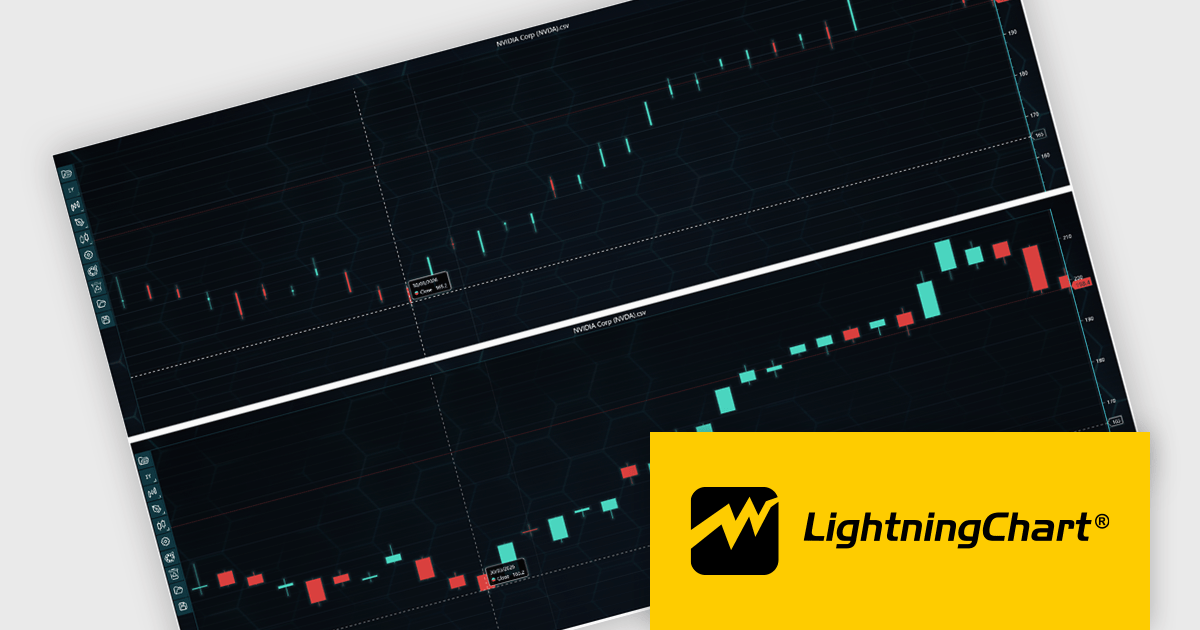
LightningChart JS Trader automatically adjusts the width of candlesticks and bars as users zoom, improving chart readability and making more effective use of available space. By reducing unnecessary gaps between data points, it provides a clearer view of price movements and trends at different zoom levels without requiring manual configuration. This helps developers deliver more intuitive financial charting experiences while retaining the option to disable the feature when fixed-width rendering is preferred.
LightningChart JS Trader is licensed per developer and is available as an annual license with 1 year support. See our LightningChart JS Trader licensing page for full details.
For more information, see our LightningChart JS Trader product page.
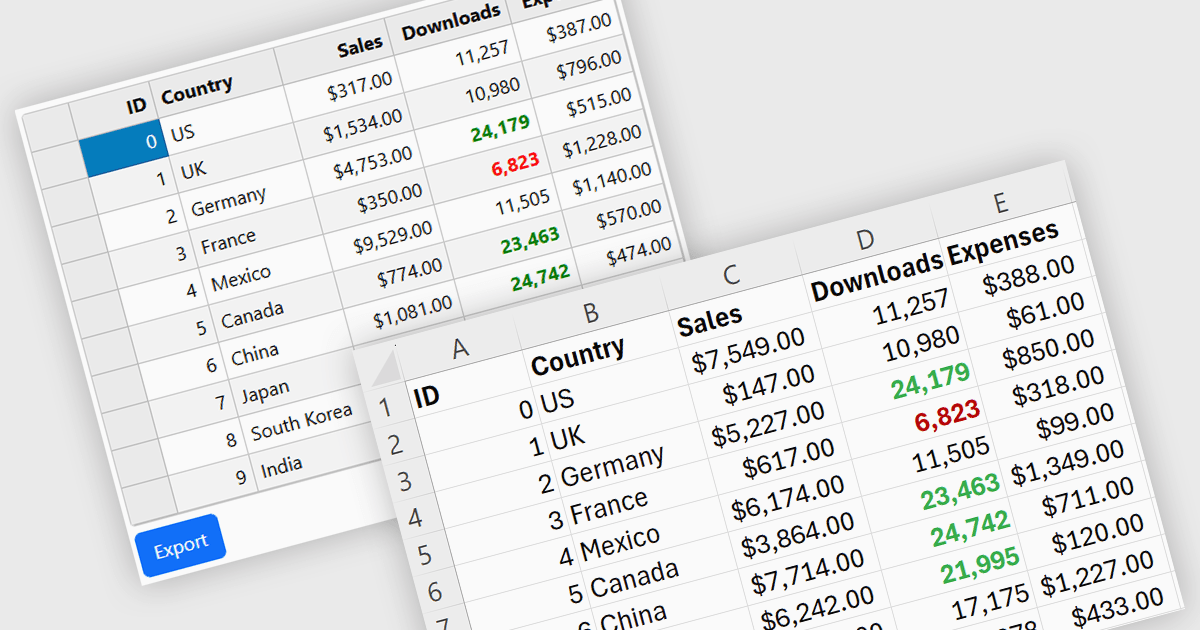
Exporting grid data to XLS/XLSX enables users to save data in Microsoft Excel-compatible formats for editing, analysis, reporting, and sharing. Common use cases include creating business reports, analyzing sales or financial data, sharing information with stakeholders, and preparing datasets for further processing.
Several Angular grid controls offer the ability to export grids to Excel including:
For an in-depth analysis of features and price, visit our Angular grid controls comparison.
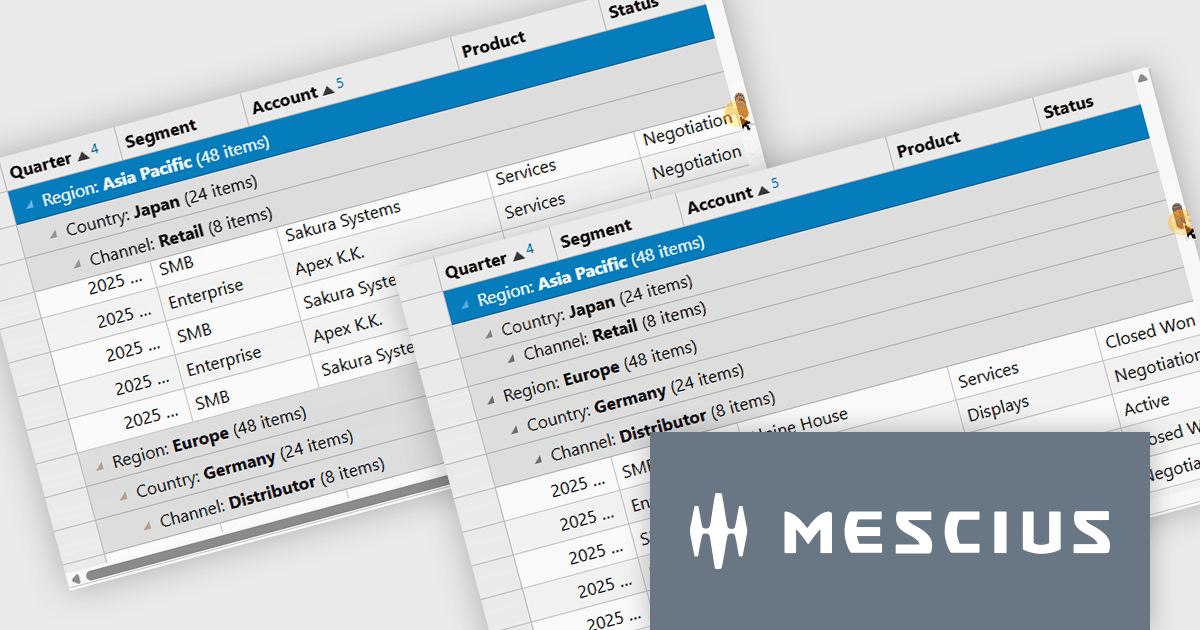
Wijmo by MESCIUS is a comprehensive JavaScript library offering a suite of high-performance UI components and data grids specifically designed to streamline the development of modern enterprise applications. It emphasizes reduced development time and improved maintainability, along with a focus on performance through its efficient design and small module size. Wijmo integrates seamlessly with popular JavaScript frameworks like Angular, React, and Vue.js, and supports cutting-edge technologies like TypeScript, making it a versatile solution for building complex web applications.
The Wijmo Build 5.20261.52 update introduces Sticky Group Headers for FlexGrid, allowing the current group header to remain visible while users scroll through grouped data. This enhancement helps developers create more intuitive data exploration experiences by improving navigation, readability, and user orientation when working with large grouped datasets. By keeping important group information accessible during scrolling, users can more easily understand their position within complex data views and work more efficiently without losing context.
To see a full list of what's new in 2026 v1 Build 5.20261.52, see our release notes.
Wijmo is licensed per developer. Developer Licenses are perpetual and include 1 year Subscription which provides upgrades, including bug fixes and new features. See our Wijmo licensing page for full details.
Learn more on our Wijmo product page.
전화 : 00798 14 800 6332
팩스 : +1 770 250 6199


