


공식 공급 업체
200 이상의 소프트웨어 개발처와 판매 계약을 맺은 공인 디스트리뷰터로서 합법적인 라이선스를 제공합니다.
모든 브랜드 보기.
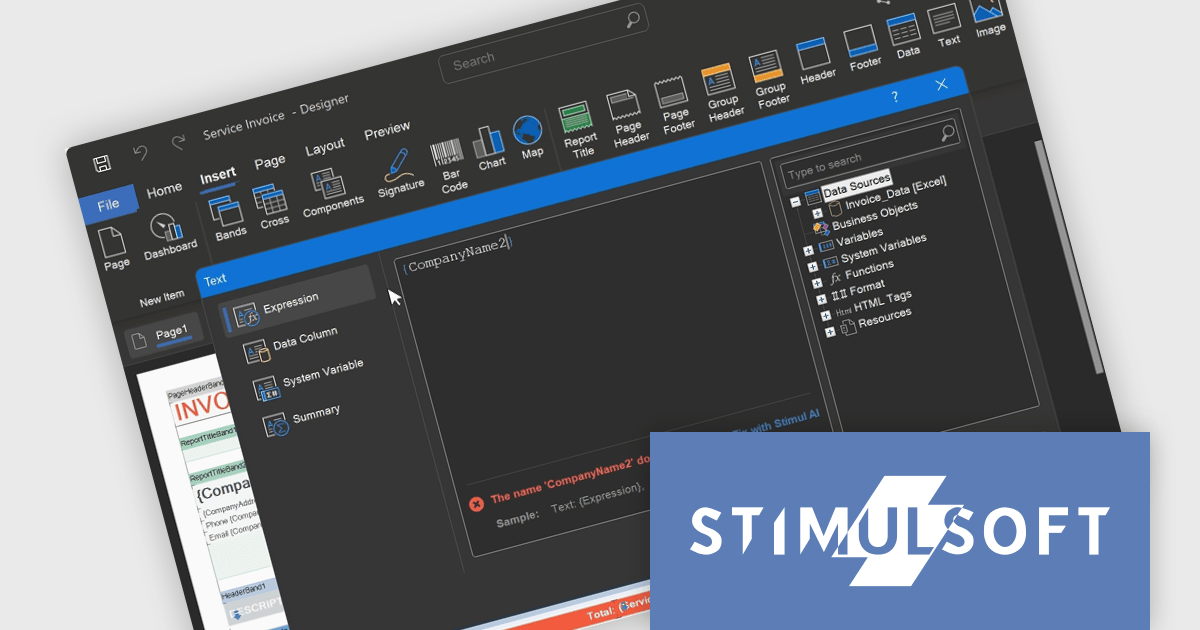
Stimulsoft BI Designer is a powerful reporting tool designed to create visually appealing and interactive reports. It empowers users to design and develop complex reports with ease, integrating data from various sources and presenting it in a clear, concise, and informative manner. With its rich feature set, Stimulsoft BI Designer is widely used in diverse industries, including finance, healthcare, retail, and manufacturing, to generate reports for analysis, decision-making, and compliance purposes. Key benefits include its intuitive interface, extensive customization options, and support for multiple data sources, making it an essential tool for organizations seeking to enhance their reporting capabilities and gain valuable insights.
The Stimulsoft BI Designer 2025.2.1 update introduces an updated expression editor that supports real-time calculation and automatic interpretation. When the report's calculation mode is set to Interpretation, expressions are evaluated instantly as the developer types, with results displayed directly in the editor. This significantly improves the speed and accuracy of report design by reducing context switching and allowing immediate validation of logic. Combined with editor interface improvements and built-in expression samples, the update provides a more efficient and responsive environment for building complex, data-driven reports.
To see a full list of what's new in 2025.2.1, see our release notes.
Stimulsoft BI Designer is available as a perpetual license and is licensed per creator. A creator has an account on the server, has access from the client-side, registered as an editor, and uses the product to work with report templates and dashboards - create, edit, view, delete, etc. See our Stimulsoft BI Designer licensing page for full details.
Stimulsoft BI Designer is available individually or as part of Stimulsoft Ultimate.
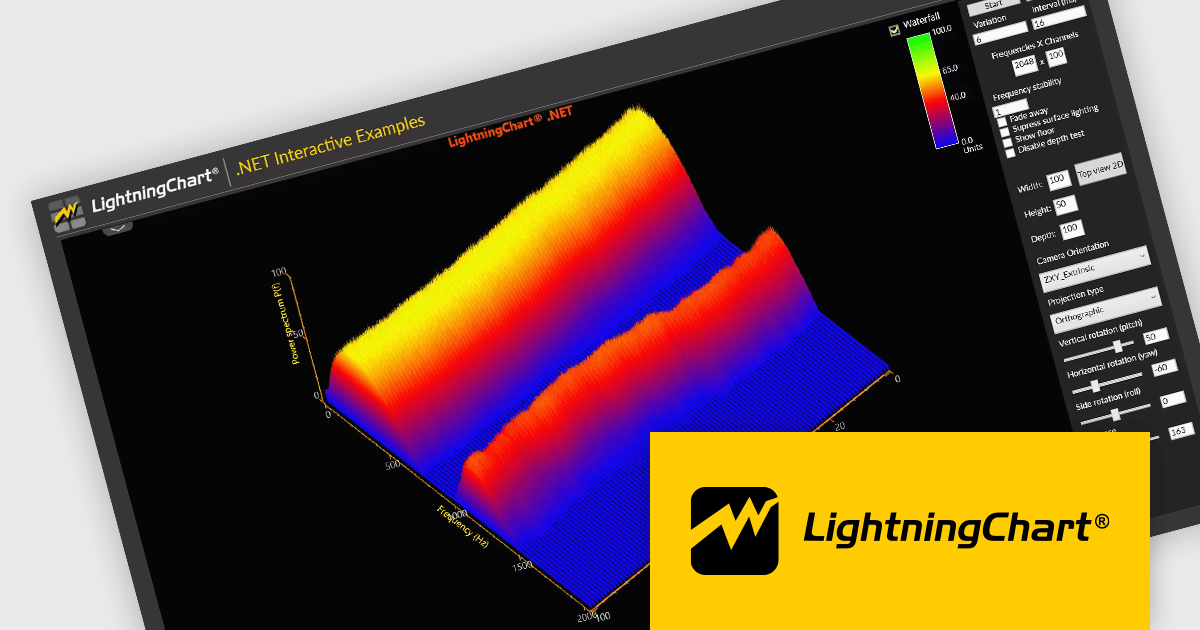
LightningChart .NET is a high-performance data visualization library designed for .NET developers working with WPF, WinForms, and UWP applications. It offers GPU-accelerated rendering for smooth real-time visualization of massive datasets, exceeding billions of data points. This library supports a wide variety of chart types, including 2D, 3D, polar, and geographic maps, along with extensive customization options for each. LightningChart .NET is a powerful tool for developers creating demanding data visualization applications requiring exceptional performance.
The LightningChart .NET v12.2.1 update adds support for .NET 9. This brings a significant performance and compatibility boost to developers building high-performance data visualization applications. By aligning with the latest version of the .NET platform, LightningChart ensures developers can take advantage of modern language features, improved memory management, and enhanced runtime performance. This results in faster chart rendering, lower latency in data updates, and better responsiveness in UI-heavy applications.
To see a full list of what's new in v12.2.1, see our release notes.
LightningChart .NET is available per developer in packages for either WPF, WinForms, UWP or all 3. Each package comes as a subscription license (with 1 or 2 years of limited support), or a perpetual license (with 1 or 2 years of Standard or Premium support). Floating licenses and site licenses are available upon request. See our LightningChart .NET licensing page for full details.
Learn more on our LightningChart .NET product page.
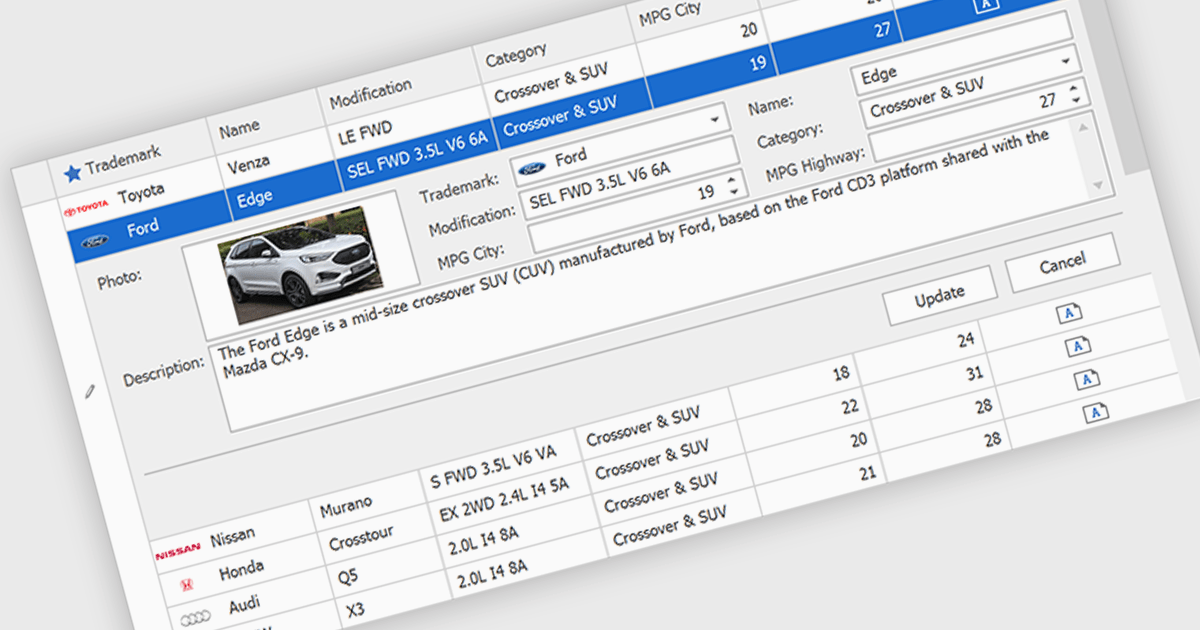
Customized Forms in .NET Grid components allow developers to tailor the structure and layout of data entry interfaces within grid-based controls, providing flexibility to match specific application requirements. These forms enable the addition of custom fields, validation logic, and user interface elements directly into the grid's editing workflow, enhancing the user experience and ensuring that data entry aligns with business rules. By offering control over how data is captured and displayed, customizable edit forms simplify complex data interactions, reduce the need for separate dialog windows, and support consistent, efficient data management within enterprise applications.
Many .NET Grid collections enable edit forms including:
For an in-depth analysis of features and price, visit our .NET grid controls comparison.
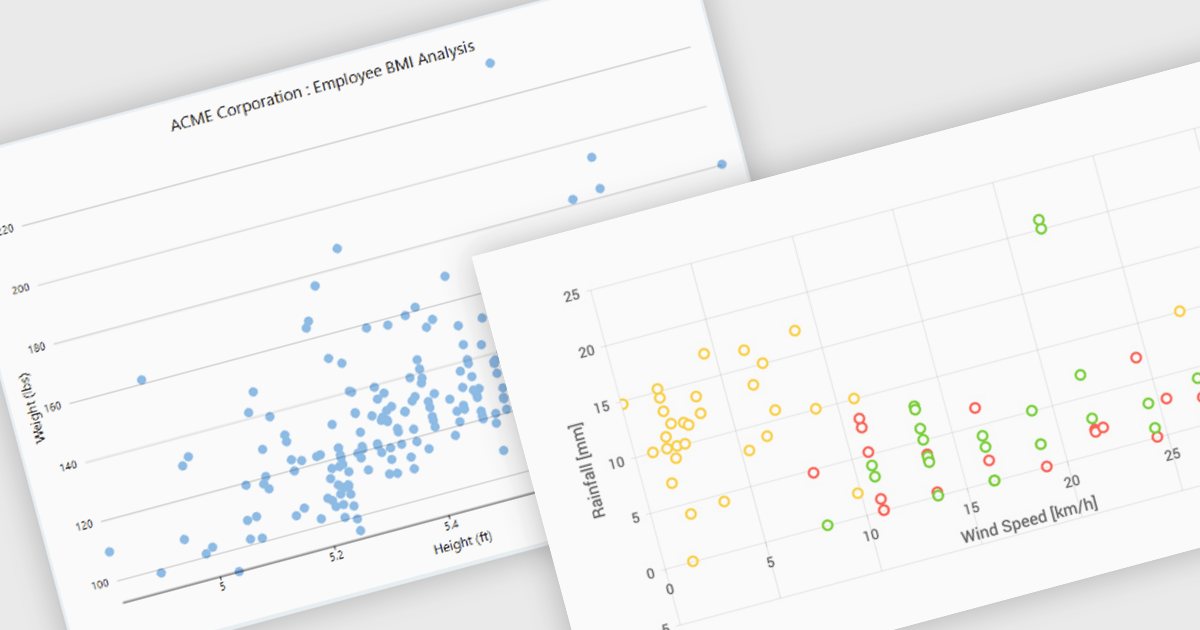
Scatter charts, also known as scatter plots or scatter diagrams, are fundamental visualization tools used to explore the relationship between two continuous variables by plotting data points, where each point's position is determined by its corresponding values for the two variables. This visual representation effectively reveals correlations and helps identify outliers, clusters, and the overall range and distribution of the data. The benefits of using scatter charts include their simplicity in conveying complex relationships, their ability to highlight anomalies that might be missed in tabular data, and their role as a precursor to more advanced statistical analyses like regression.
Several .NET WinForms chart controls offer scatter charts including:
For an in-depth analysis of features and price, visit our .NET WinForms chart controls comparison.
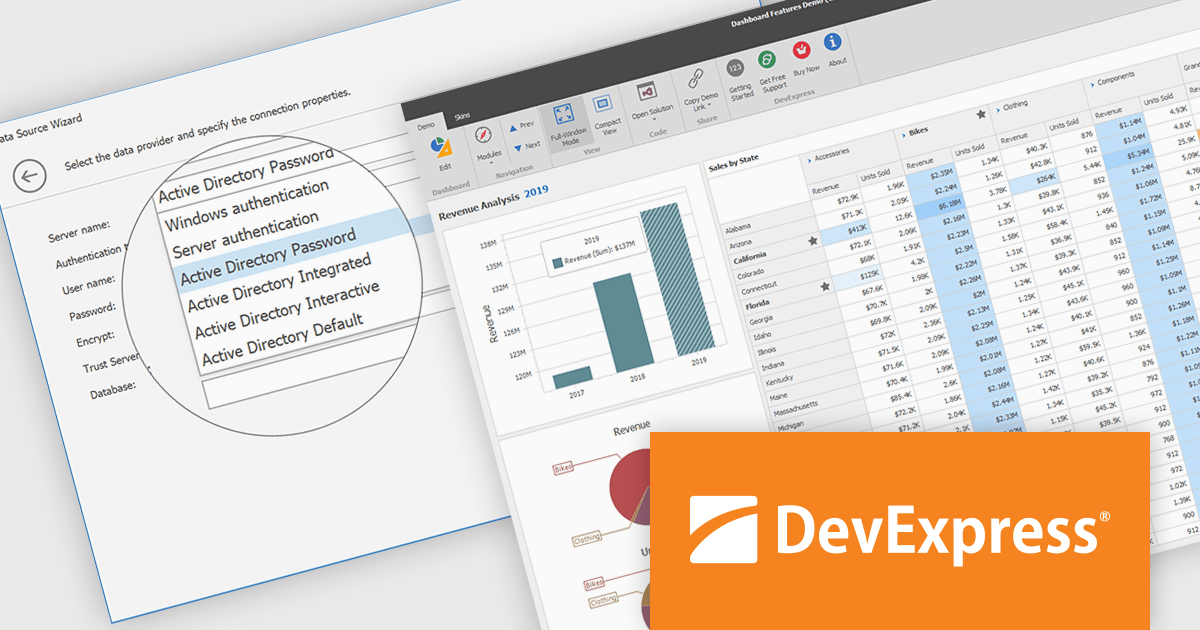
DevExpress BI Dashboard (part of DevExpress Universal) empowers you to craft interactive dashboards for desktop, web and mobile applications. It provides a visual designer for building dashboards without writing code, allowing you to drag-and-drop various data visualization widgets onto the canvas. These widgets connect to your data sources and update dynamically, offering real-time insights to end users. The tool also supports customization through properties and events, enabling you to tailor the look and feel of the dashboards to perfectly integrate with your application's design.
The DevExpress BI Dashboard 24.2 update enhances data security and simplifies connectivity by integrating Microsoft Entra authentication for Azure SQL databases. This update allows developers to use modern Active Directory-based authentication methods, such as ActiveDirectoryPassword, ActiveDirectoryIntegrated, ActiveDirectoryInteractive, and ActiveDirectoryDefault, ensuring that access to critical data is both secure and compliant with current enterprise standards.
To see a full list of what's new in version 24.2, see our release notes.
DevExpress BI Dashboard is included as part of DevExpress Universal which is licensed per developer and is available as a Perpetual License with a 12 month support and maintenance subscription. See our DevExpress Universal licensing page for full details.
DevExpress BI Dashboard is available in the following products:
전화 : 00798 14 800 6332
팩스 : +1 770 250 6199


