
공식 공급 업체
200 이상의 소프트웨어 개발처와 판매 계약을 맺은 공인 디스트리뷰터로서 합법적인 라이선스를 제공합니다.
모든 브랜드 보기.
Chart FX 8 is a powerful charting engine that supports a large collection of chart types including bar, area, pie, line, curve, bubble, Parento, polar and surface. It lets developers and end users navigate through data. It features grouping, filtering, sorting and pivoting, all without writing a single line of code.
Software FX was founded in September of 1993 as a component vendor. By providing top-of-the-line components for different development environments, they continue to lead the market in deploying graphical development tools. Software FX is committed to providing a rich set of tools and support for past, present and future technologies for the global development community.
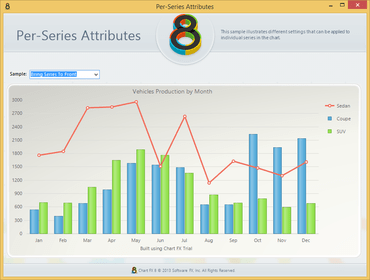
.NET 개발자를 위한 고급 데이터 분석 및 시각화.
Software FX 사 제품 라이선스 담당자와 라이브 채팅

1999 이래 공식 유통업체
전화 : 00798 14 800 6332
팩스 : +1 770 250 6199


