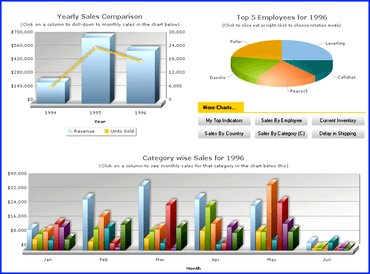
FusionCharts XT V3.11.3

신규 Annual Licensing 및 FusionCharts를 위한 버그 수정을 제공합니다.
11월 4, 2016
신규 버전

기능

Licensing Model Change: The current pricing plan has been changed as of Nov 1st, 2016 to an annual license model for new customers, based on the number of developers. To continue to use the software after 1 year new customers will need to purchase the annual license again. Please Note: Existing customers may continue to renew their current licenses under the previous license model to get support and product updates, plus existing customers may upgrade their current license to Team, Enterprise or Enterprise Plus license options under the older license model.

Common Updates:

  • Toolbars can now be customized using the following attributes:
    • toolbarX
    • toolbarY
    • toolbarHAlign
    • toolbarYAlign
    • toolbarPosition
  • The message font and font color can now be customized when the ​showChartMessage() method is used to set custom chart messages. The ​showChartMessage() API is now modified to: showChartMessage(text, modal, cancelable, customAttrs) Where, ​customAttrs is an object that​ can take the ​color, ​fontSize, and ​font attributes as values.
  • Tooltips no longer overflow out of charts. Previously, in spite of enough space being available, the tooltips would flow out of charts. Now, if there is sufficient rendering space available, the tooltip is constrained to fit inside the chart.
  • Trailing commas in the JS code generated by the .NET wrapper have now been removed.

수정사항

FusionCharts Fixes:

  • For the zoomline dual y-axis chart, the traditional tooltip now includes the value of the sNumberPrefix attribute. Previously, when the ​numberPrefix and ​sNumberPrefix attributes were defined, only the value for the ​numberPrefix attribute was rendered in the tooltip.
  • The ​sNumberSuffix​ attribute is now applied to the csv data for dual y-axis charts.
  • For the pie and doughnut charts, label space management has been implemented for all valid values of the ​labelFontSize attribute. Previously, labels overlapped for larger font sizes.
  • For the pie and doughnut charts, the ​enableSlicing attribute can now be used at the ​data object level to enable/disable slicing for a particular data plot. Previously, ​enableSlicing was supported only at the ​chart object level.
  • Incorrect width calculation, when the ‘/’ character is included in the smart label for pie and doughnut charts, has been fixed.
  • For multi-series charts, when the ​plotHighlightEffect​ attribute is defined, the JS error thrown upon hovering over a legend item has been fixed.

Common Fixes:

  • Behavioral issues encountered when the ​clickURL​ attribute and the ​export event are used together have been fixed. Previously, the events would be triggered together resulting in chart export and redirection happening at the same time.
  • Message log buttons are now hidden when ​messageGoesToLog=0.
  • Tooltip rendering issues in the Bootstrap Modal Window have been fixed.
  • For all Cartesian charts, when ​decimals=0, the issue of numeric values repeating for consecutive div lines along the y-axis has been fixed.
  • Y-axis scaling is now done based on trend-line values, along with data values. Previously, when the trend-line values were not included, due to the difference between the largest data value and the trend-line value, the latter was often not visible on the chart.
  • For server-side export, the ​exported event is now triggered as expected. Previously, the event was not triggered when ​exportAction=save.
  • The ​exportFormats attribute can now be used for enabling export in selected formats. Previously, even though a single format was passed as value to this attribute, the export menu still showed all the supported formats.
FusionCharts XT

FusionCharts XT

동적인 웹 애플리케이션을 위한 JavaScript (HTML5) 엔터프라이즈-등급의 차트 및 그래프.

FusionCharts XT 도 구매할 수 있습니다:

궁금한 점이 있으세요?

FusionCharts 사 제품 라이선스 담당자와 라이브 채팅