FastReport Business Graphics .NET 릴리스

.NET WinForms에 대한 데이터 시각화 라이브러리.
7월 9, 2021
신제품

기능

Features:

  • Connection - Connect to data from any application, including FastCube .NET.
  • Interactivity - When static reports are not enough the included charts offer improved interactivity allowing you to navigate through your data smoothly.
  • Smart decisions - Help businesses make better informed decisions by providing better visualization of your data at glance.
  • Integration - Integrate with the Microsoft .NET Framework report generator FastReport .NET and OLAP pivot grid FastCube .NET.

Data visualization library:

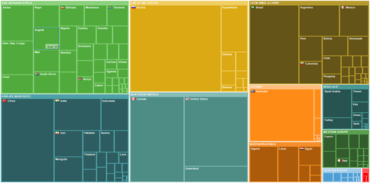
  • Treemap chart - A way of visualizing hierarchical data in the form of rectangles whose area is proportional to the value of the displayed record. This tree chart is suitable for comparing several hierarchies at the same time.
  • Sunburst chart - A sun-like chart with branching rays. This chart is suitable for analyzing each level of the hierarchy.
  • Icicle chart - Allows you to present data based on the hierarchical clustering method. The advantages are that it is easy to see the hierarchy, its size and the level at which it is located. It's also great for examining data relationships.
  • Gantt chart - Allows you to illustrate a work plan/schedule for a project. Using a Gantt chart makes it much easier to manage small projects.
FastReport Business Graphics .NET

FastReport Business Graphics .NET

.NET WinForms에 대한 데이터 시각화 라이브러리.

궁금한 점이 있으세요?

Fast Reports 사 제품 라이선스 담당자와 라이브 채팅