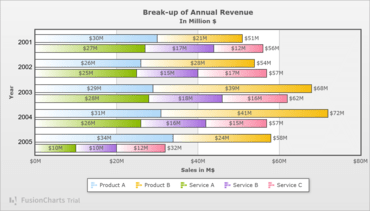
새로운 그룹 스택트 바 차트(MSStackedBar2D)를 추가하고 Angular 및 React에 대한 지원을 업데이트합니다.
8월 12, 2022
신규 버전
기능
FusionCharts 3.19
Added a new Group Stacked Bar chart called the MSStackedBar2D chart which helps users represent data values as a sum of two or more values.
Added the ability to show the percentage value with the corresponding legend in Doughnut and Pie charts.
Updated Angular integration to support Angular versions 11, 12, and 13.
Updated React integration to support React versions 16, 17, and 18.
Improved PDF encoding allowing users to save and export PDF files on a local server. Previously, saving a PDF resulted in a corrupted file.
The FusionMap feature now shows the Indian region of Ladakh as a separate entity.
Added the ability for users to define the legend container's width.
Improved the readability of Multiseries charts by preventing plotted value series from overlapping when using the same or similar values.
FusionTime 2.7
Improved chart visualization by allowing users to use the new paletteColor feature to specify a custom color for an individual series at plot level in a column visualization.