ComponentOne Studio Enterprise
어워드 수상 경력에 빛나는 모바일, Web 및 데스크탑용 .NET 및 JavaScript 컨트롤.
강력한 데이터 시각화 - 80개 이상의 차트, Gantt 뷰, 피벗 테이블, 게이지, 지도 혹은 스파크라인을 제공하는 한편, ComponentOne Studio의 데이터 시각화 컨트롤은 대용량의 데이터 세트를 컨트롤 하며, 프로페셔널한 디자인으로 귀하의 사용자를 감동 시킵니다.

설명: A radial line and area layout visualization. Vizuly Corona is a radial chart that provides angular and curved radial area line curves and supports both an overlap and stacked layout. It also features over a dozen different dynamic styles and comes bundled ... 더 읽기 본 제품에 관한 더 많은 결과 보기
설명: 방사형 라인 및 영역 레이아웃 시각화. Vizuly Corona is a radial chart that provides angular and curved radial area line curves and supports both an overlap and stacked layout. It also features over a dozen different dynamic styles and comes bundled with an easy to use ... 더 읽기
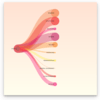
설명: Represent asymmetric hierarchical information in an easy to read visualization. Vizuly Weighted Tree nodes and branches can be dynamically sized and styled based on data bound properties that you set. One challenge with large hierarchal tree structures is ... 더 읽기 본 제품에 관한 더 많은 결과 보기
설명: 읽기 쉬운 시각화로 비대칭 계층적 정보를 나타냅니다. Vizuly Weighted Tree nodes and branches can be dynamically sized and styled based on data bound properties that you set. One challenge with large hierarchal tree structures is being able to easily navigate the tree when many ... 더 읽기

설명: Represent transactional relationships from a specified number of sources to a variable number of targets. Vizuly Halo uses several different data visualization techniques to represent transactional relationships from a specified number of sources to a ... 더 읽기 본 제품에 관한 더 많은 결과 보기
설명: 지정된 수의 소스에서 가변 개수의 대상으로 트랜잭션 관계를 나타냅니다. Vizuly Halo uses several different data visualization techniques to represent transactional relationships from a specified number of sources to a variable number of targets. Sources are represented as segmented arcs ... 더 읽기

설명: Represent cartesian x/y data within a radial plot. Vizuly Radial Bar is designed to represent cartesian x/y data within a radial plot. It supports both clustered and stacked radial bars Use the interactive style explorer on the left to view different ... 더 읽기 본 제품에 관한 더 많은 결과 보기
설명: 방사형 플롯 내에서 cartesian x/y 데이터를 나타냅니다. Vizuly Radial Bar is designed to represent cartesian x/y data within a radial plot. It supports both clustered and stacked radial bars Use the interactive style explorer on the left to view different style settings, ... 더 읽기
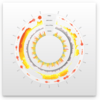
설명: Easily display multi-variate time series information. Vizuly Ring Chart lets you easily display multi-variate time series information. Due to its radial form factor, you can display 3 times the information for a given screen width than you could with a ... 더 읽기 본 제품에 관한 더 많은 결과 보기
설명: 다중-변량(variate) 시계열 정보를 손쉽게 표시 합니다. Vizuly Ring Chart lets you easily display multi-variate time series information. Due to its radial form factor, you can display 3 times the information for a given screen width than you could with a more traditional ... 더 읽기
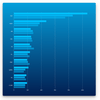
설명: Add stacked and clustered bar charts to your JavaScript apps. Vizuly Bar Chart supports both stacked and clustered layout options, as well as over 2 dozen different dynamic styles. It also comes bundled with a test container and examples of different ... 더 읽기 본 제품에 관한 더 많은 결과 보기
설명: JavaScript 앱에 누적(stacked) 및 묶은(clustered) 막대(bar) 차트를 추가 합니다. Vizuly Bar Chart supports both stacked and clustered layout options, as well as over 2 dozen different dynamic styles. It also comes bundled with a test container and examples of different ... 더 읽기
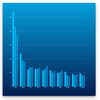
설명: Add stacked and clustered column charts to your JavaScript apps. Vizuly Column Chart supports both stacked and clustered layout options, as well as over 2 dozen different dynamic styles. It also comes bundled with a test container and examples of ... 더 읽기 본 제품에 관한 더 많은 결과 보기
설명: JavaScript 앱에 누적(stacked) 및 묶은(clustered) 세로 막대형 차트를 추가 합니다. Vizuly Column Chart supports both stacked and clustered layout options, as well as over 2 dozen different dynamic styles. It also comes bundled with a test container and examples of different ... 더 읽기
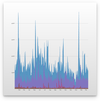
설명: Add line and area charts to your JavaScript apps. Vizuly Line Area Chart supports both line and area plots in several different layout options. It also comes bundled with a test container demonstrating the various chart properties and different style ... 더 읽기 본 제품에 관한 더 많은 결과 보기
설명: JavaScript 앱에 라인 및 영역 차트를 추가 합니다. Vizuly Line Area Chart supports both line and area plots in several different layout options. It also comes bundled with a test container demonstrating the various chart properties and different style themes. You can ... 더 읽기
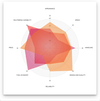
설명: Add Radar charts to your JavaScript apps. Vizuly Radar Chart graphs multiple dimensions of one datum along multiple radial axis. Each plot represents 3 or more data points along shared axis lines. This chart supports highlighting of both individual data ... 더 읽기 본 제품에 관한 더 많은 결과 보기
설명: JavaScript 앱에 Radar 차트를 추가 합니다. Vizuly Radar Chart graphs multiple dimensions of one datum along multiple radial axis. Each plot represents 3 or more data points along shared axis lines. This chart supports highlighting of both individual data points and ... 더 읽기
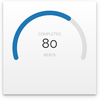
설명: Show numeric values within a minimum and maximum range. Vizuly Radial Progress is designed to show numeric values within a minimum and maximum range. It can also show when a value has exceeded the maximum threshold. This chart supports a variable range of ... 더 읽기 본 제품에 관한 더 많은 결과 보기
설명: 최소 및 최대 범위 내에서 숫자 값을 표시 합니다. Vizuly Radial Progress is designed to show numeric values within a minimum and maximum range. It can also show when a value has exceeded the maximum threshold. This chart supports a variable range of start/stop angles, arc end ... 더 읽기