Vizuly Radar Chart

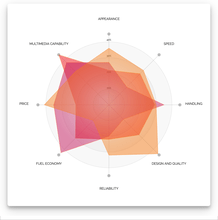
Vizuly Radar Chart graphs multiple dimensions of one datum along multiple radial axis. Each plot represents 3 or more data points along shared axis lines. This chart supports highlighting of both individual data points and the group as a whole.

Features

  • Supports Vertex Point and Group Highlighting
  • Angular or Curve Line Types
  • 6 example themes
  • More than a dozen dynamic styles
  • Dozens of adjustable properties and interactive event support
  • Customizable Data Tips
  • Documentation

Framework Adapters

  • React Adapters
  • Angular Adapters
  • Vue.js Adapters

최신 뉴스

Vizuly Radar Chart released
June 7, 2019신제품
JavaScript 앱에 Radar 차트를 추가 합니다.

가격: ₩ 79,600

Vizuly Developer Licensing: Developer License allows a single developer to use the Software on an unlimited number of websites, intranets, web applications and SaaS projects, Developer License allows...

Vizuly Radar Chart 도 구매할 수 있습니다:

궁금한 점이 있으세요?

Vizuly 사 제품 라이선스 담당자와 라이브 채팅

Vizuly
Vizuly사 제품의 배포자로서 공식 권한을 소유한 ComponentSource는 합법적인 라이선스를 고객님께 직접 제공합니다.
콤포넌트 타입
  • JavaScript
  • 반응
  • 각도
  • 뷰 js