Fornecedor oficial
Como distribuidores oficiais e autorizados, nós fornecemos licenças legítimas diretamente de mais de 200 editores de software.
Ver todas as nossas marcas.

Capturas de tela: Graph chart showing social network of a person. ...

Capturas de tela: Radial graph chart with expandable nodes showing social network. ...

Capturas de tela: Radial graph chart displaying all data showing category based data. ...

Recursos: TeeChart for Blazor offers Charts as live render types Javascript, SVG and static image formats including PNG and JPEG. Most widely used series types are available as the live, javascript format. ...

Capturas de tela: Bubble chart. ...

Capturas de tela: Flow chart with random data. ...
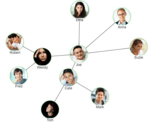
Capturas de tela: Network chart with expandable nodes with dynamic layout. ...

Capturas de tela: Dot matrix chart with fixed coordinates. ...
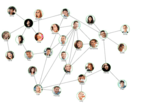
Capturas de tela: Network chart showing all data for social network with dynamic layout. ...

Recursos: Add chart layers and statistical and technical indicators to our popular charts with ease and elegance. Compare multiple measurements, so your users can make better informed decisions. Enrich ... the Bullet Graph’s look and feel with visually impressive animations and styles. ...
Notas de versão: Updates in V4.4 Simulated Annealing graph layout algorithm LayeredLayout.StraightenLongLinks limits the number of links bends TrackingRectColor property added to Overview More precise text measuring ...
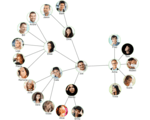
Capturas de tela: Radial network chart with expandable nodes. ...

Capturas de tela: Radial network chart displaying all data. ...
Notas de versão: Updates in V5.6.3 CompositeLayout multi-level graph layout algorithm Improved alignment in FlowchartLayout branches OrthogonalLayout improved to create less link bends DisableMirroring constraint ...
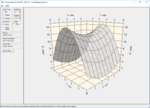
Capturas de tela: ComponentOne Chart for.NET is a powerful charting control to create fast 2D and 3D charts and graphs 0 ...

Capturas de tela: The chart activity renderer is a good starting point to design chart activity graphs. 0 ...

Descrição: Create great looking Graphs and Charts in Java. Big Faceless Graph Library allows you to create industry leading Graphs and Charts in Java. Backed by a full 3D engine, the Graph Library can plot 2D ... or shaded 3D Pie Charts, Line Graphs, Area and Bar Graphs from any viewpoint to PNG, Flash, PDF or SVG, quickly and with stunning results. Big Faceless Graph Library Features include: XML and JSP Tag Library ... . Create funnel charts. Add text, lines or custom markers anywhere on the graph, including axes. Use up to four axes on the one graph, including logarithmic axes. Plot mathematical functions, data samples ...
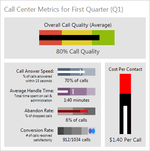
Capturas de tela: A bullet graph is a special kind of bar chart used to display a single value in a context of one or more related values. ...
Notas de versão: New component lets you add React Native charts and graphs to Android and iOS applications. React Native Component For FusionCharts With the new component, developers can add React Native charts ... and graphs (area, bar, donut, line, marimekko, radar, stockcharts and more along with 1000+ maps) to their Android and iOS application. Using the React Native component you can create charts ... reactive. All charts and graphs are tested and built for millions of data points without any performance issues. ...
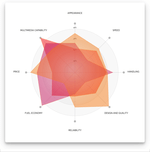
Descrição: Add Radar charts to your JavaScript apps. Vizuly Radar Chart graphs multiple dimensions of one datum along multiple radial axis. Each plot represents 3 or more data points along shared axis lines. ... This chart supports highlighting of both individual data points and the group as a whole. Features Supports Vertex Point and Group Highlighting Angular or Curve Line Types 6 example themes More than a dozen ...