Componentes de camada de apresentação / Codejock Software / Vizuly / AutoDWG - Melhor Vendidos

  1. Descrição: Give your application a professional, modern appearance. Codejock Toolkit Pro for Visual C++ MFC helps you create professional applications that incorporate a full set of highly customizable user interface components including Visual Studio style docking ... Leia mais

  2. Descrição: Give your application a professional, modern appearance with toolbars, menus, docking, property grid, reporting and calendar functionality. Codejock Suite Pro helps you create professional applications that incorporate a full set of highly customizable ... Leia mais

  3. $$$ | Compra

    Descrição: Convert CAD drawings between DWG and DXF formats without AutoCAD. The AutoDWG DWG DXF ActiveX component allows you to convert drawings between DXF and DWG, and AutoCAD file version conversions, without the need for AutoCAD. Convert DWG to DXF and convert ... Leia mais

  4. $ | Compra

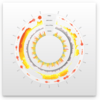
    Descrição: A radial line and area layout visualization. Vizuly Corona is a radial chart that provides angular and curved radial area line curves and supports both an overlap and stacked layout. It also features over a dozen different dynamic styles and comes bundled ... Leia mais

  5. 5. Vizuly Halo Comprar agora

    Marca: Vizuly
    Categoria principal: Componentes de gráfico
    $ | Compra

    Descrição: Represent transactional relationships from a specified number of sources to a variable number of targets. Vizuly Halo uses several different data visualization techniques to represent transactional relationships from a specified number of sources to a ... Leia mais

  6. $ | Compra

    Descrição: Represent cartesian x/y data within a radial plot. Vizuly Radial Bar is designed to represent cartesian x/y data within a radial plot. It supports both clustered and stacked radial bars Use the interactive style explorer on the left to view different ... Leia mais

  7. $ | Compra

    Descrição: Easily display multi-variate time series information. Vizuly Ring Chart lets you easily display multi-variate time series information. Due to its radial form factor, you can display 3 times the information for a given screen width than you could with a ... Leia mais

  8. $ | Compra

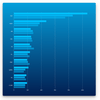
    Descrição: Add stacked and clustered bar charts to your JavaScript apps. Vizuly Bar Chart supports both stacked and clustered layout options, as well as over 2 dozen different dynamic styles. It also comes bundled with a test container and examples of different ... Leia mais

  9. $ | Compra

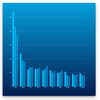
    Descrição: Add stacked and clustered column charts to your JavaScript apps. Vizuly Column Chart supports both stacked and clustered layout options, as well as over 2 dozen different dynamic styles. It also comes bundled with a test container and examples of ... Leia mais

  10. $ | Compra

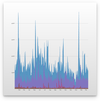
    Descrição: Add line and area charts to your JavaScript apps. Vizuly Line Area Chart supports both line and area plots in several different layout options. It also comes bundled with a test container demonstrating the various chart properties and different style ... Leia mais