Trends zusammen mit den entsprechenden Daten anzeigen

Mai 17, 2024
Die Integration von Sparklines in Raster hilft Benutzern bei der Erkennung von Mustern über Zeilen und Spalten hinweg, was eine schnelle und aufschlussreiche Analyse großer Datensätze ermöglicht.

Auf Englisch weiterlesen:

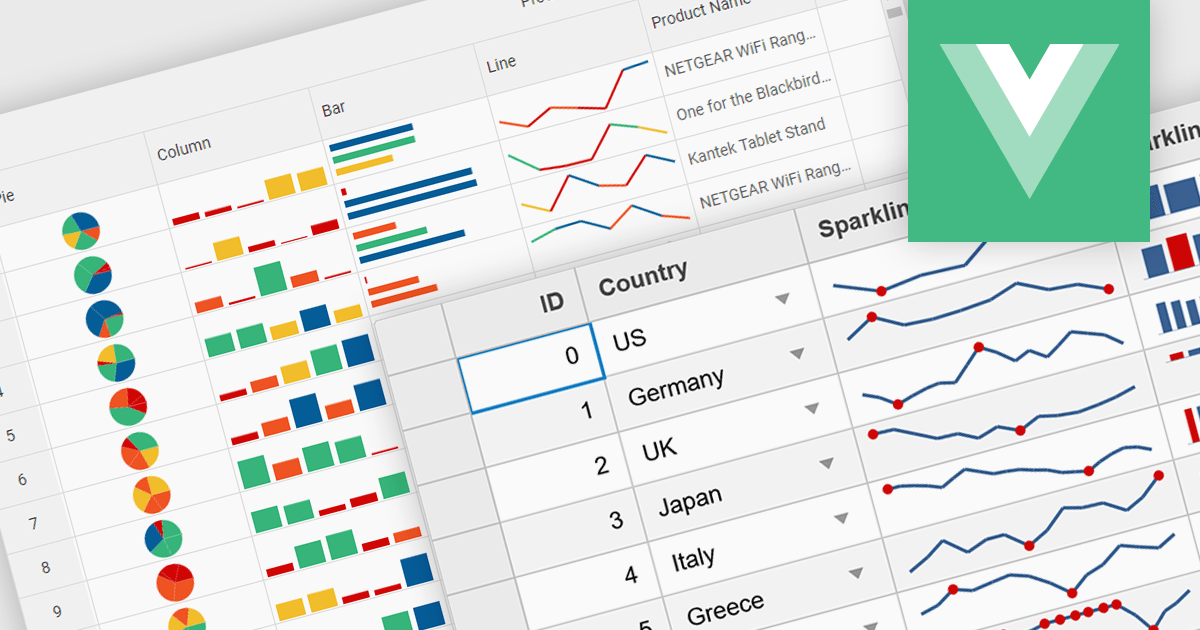
Sparklines are miniature charts embedded directly within grid cells, providing a quick visual summary of data trends within a larger dataset. These tiny line graphs, often lacking axes or detailed labels, condense information into a highly space-efficient format, allowing viewers to grasp patterns and fluctuations at a glance across multiple rows and columns of a grid.

Several Vue.js grid controls offer support for sparklines including:

  • Kendo UI for Vue Grid (part of Kendo UI by Telerik) empowers developers to integrate insightful sparklines within Vue grids, offering a concise view of data trends.
  • Wijmo FlexGrid (part of Wijmo by MESCIUS) facilitates data exploration through sparklines embedded directly in cells, enhancing visual analysis without overwhelming users.
  • Jspreadsheet Pro Data Grid offers a robust data manipulation platform, where sparklines can be incorporated into cells to visually represent data trends.
  • Smart HTML Elements Grid allows developers to seamlessly integrate sparklines into grids, enabling users to gain quick insights from data fluctuations.
  • Syncfusion Grid control for JavaScript (part of Syncfusion Essential Studio Enterprise) lets you leverage sparklines for efficient data pattern recognition within the grid.

For an in-depth analysis of features and price, visit our Vue.js Grid controls comparison.

Compare Vue.js Grid Controls