Offizieller Lieferant
Als offizieller und autorisierter Distributor beliefern wir Sie mit legitimen Lizenzen direkt von mehr als 200 Softwareherstellern.
Sehen Sie alle unsere Marken.
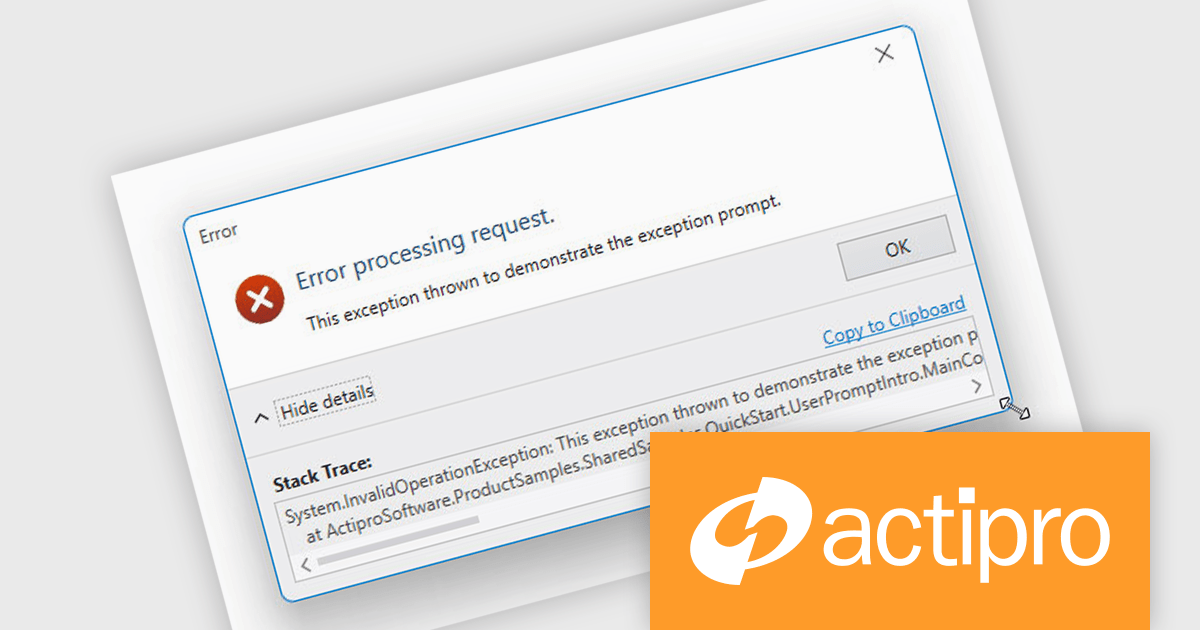
Actipro WPF Essentials is a robust suite of user interface controls designed specifically for Windows Presentation Foundation (WPF) applications. It includes a set of advanced components that enhance the standard WPF experience, focusing on both usability and visual appeal. The product provides developers with high-performance tools such as sophisticated docking windows, property grids, and enhanced controls like task panes and themes, making it easier to build rich, interactive desktop applications.
The Actipro WPF Essentials v25.1 update adds support for resizable user prompts, making it easier to implement adaptable dialog boxes. With just one configuration change, developers can now allow end users to adjust prompt sizes, improving usability and accessibility. This feature removes the need for custom resizing logic and ensures consistent behavior across different applications, supporting more responsive and user-friendly interfaces.
To see a full list of what's new in v25.1, see our release notes.
Actipro WPF Essentials is licensed per developer and is available as a Perpetual license with 1 year support and maintenance. See our Actipro WPF Essentials licensing page for full details.
Actipro WPF Essentials is available in the following products:
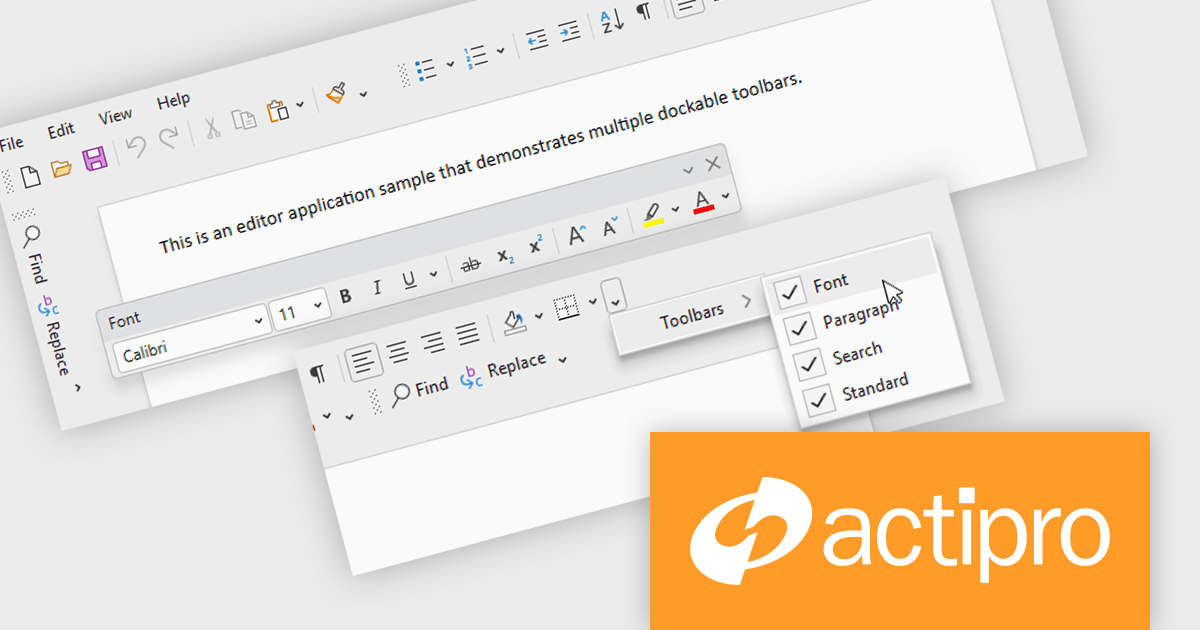
Actipro Bars for WPF is a UI component library that equips developers with the tools to build advanced ribbons, toolbars, and menus within their WPF applications. It offers an "Office-like" ribbon experience with customization options, supports MVVM design patterns, and includes a rich set of controls specifically designed for use within these elements, allowing for a cohesive and user-friendly interface.
The Actipro Bars for WPF v25.1 update introduces Visual Studio-style dockable toolbars that can be positioned on any edge of a host control or detached and moved to secondary monitors. This provides a highly adaptable workspace layout that users can configure to fit their preferences. Developers gain fine control over docking behavior, floating, stacking, and visibility settings through exposed properties, allowing for a dynamic and customizable interface without requiring complex custom coding.
To see a full list of what's new in v25.1, see our release notes.
Actipro Bars for WPF is licensed per developer and is available as a Perpetual license with 1 year support and maintenance. See our Actipro Bars for WPF licensing page for full details.
Actipro Bars for WPF is available in the following products:
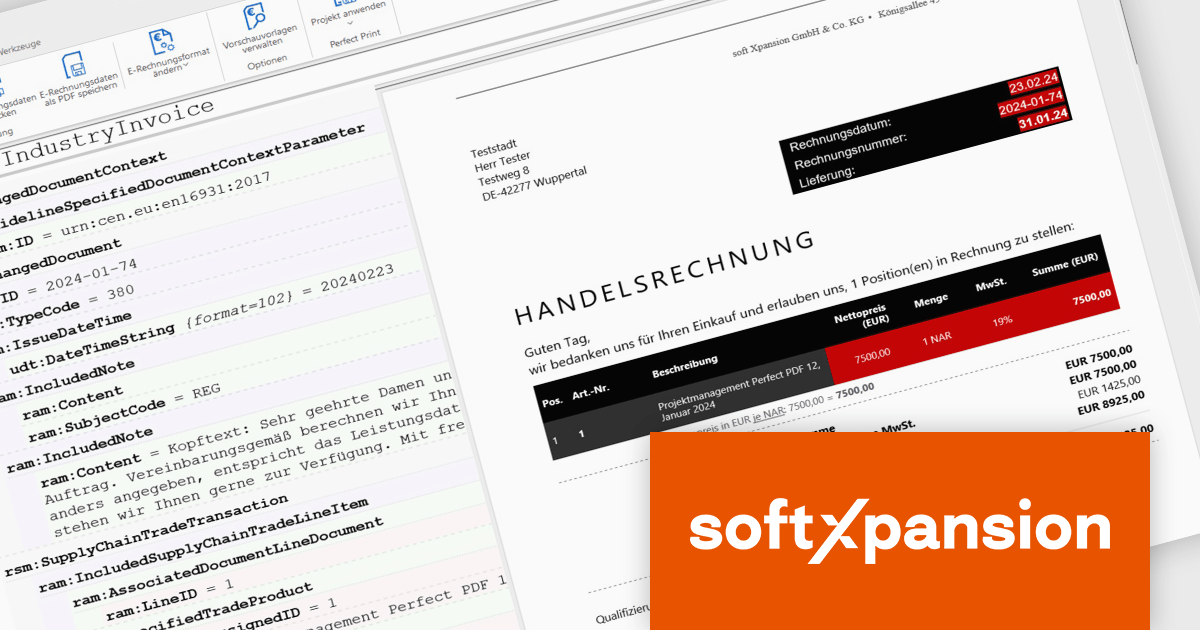
The PDF Xpansion SDK from Soft Xpansion is a powerful development toolkit for integrating advanced PDF and electronic document processing into desktop, server, and mobile applications. It supports creating, editing, converting, displaying, and printing PDF files, along with handling related formats like XPS and OpenXPS. The SDK complies with ISO PDF standards and offers robust features for digital signatures, form processing, text extraction, and document security. It also includes specialized capabilities for e-invoicing, supporting formats such as ZUGFeRD and Factur-X, and provides PDF viewer functionality for seamless document display. This makes it an ideal solution for automating document workflows and ensuring regulatory compliance in enterprise environments.
The PDF Xpansion SDK 17.1.3 update introduces official support for both .NET 8 and the latest .NET 9, enabling developers to integrate advanced PDF functionality into modern applications while taking full advantage of the newest runtime optimizations and language enhancements. This ensures higher performance, improved scalability, and stronger security for document processing solutions. With support for .NET 9, development teams can leverage cutting-edge features such as improved Just-In-Time (JIT) and native Ahead-Of-Time (AOT) compilation, resulting in faster application startup times and reduced memory consumption. This update helps future-proof projects and supports the latest trends in application development.
PDF Xpansion SDK products are licensed per company location where developers use the SDKs. Optional Add-Ons are available which require ownership of SDK site licenses. Maintenance Subscription is available providing product updates (error corrections) and support services. See the product license pages for full details:
Learn more about PDF Xpansion SDK on our product pages:
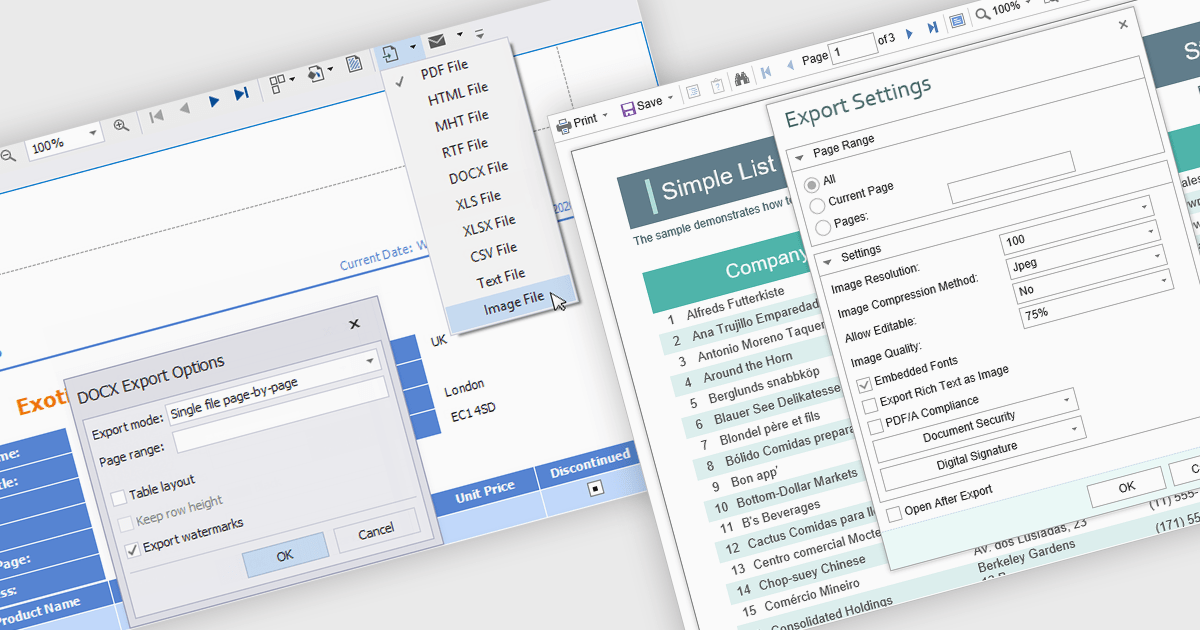
The export to image feature in reporting tools allows users to save a static visual representation of their reports in common image formats such as PNG or JPEG. This functionality offers numerous benefits, including simplified sharing across diverse platforms without requiring specific software, ensuring the consistent presentation of data by preserving formatting and visualizations, and enabling offline access for users who may not have continuous network connectivity. Example use cases include easily embedding key performance indicator dashboards into presentations or emails for broad dissemination, archiving reports for historical record-keeping, and providing accessible versions of data insights for individuals who prefer or require visual formats.
Several .NET WPF reporting controls offer image exporting including:
For an in-depth analysis of features and price, visit our WPF Reporting controls comparison.
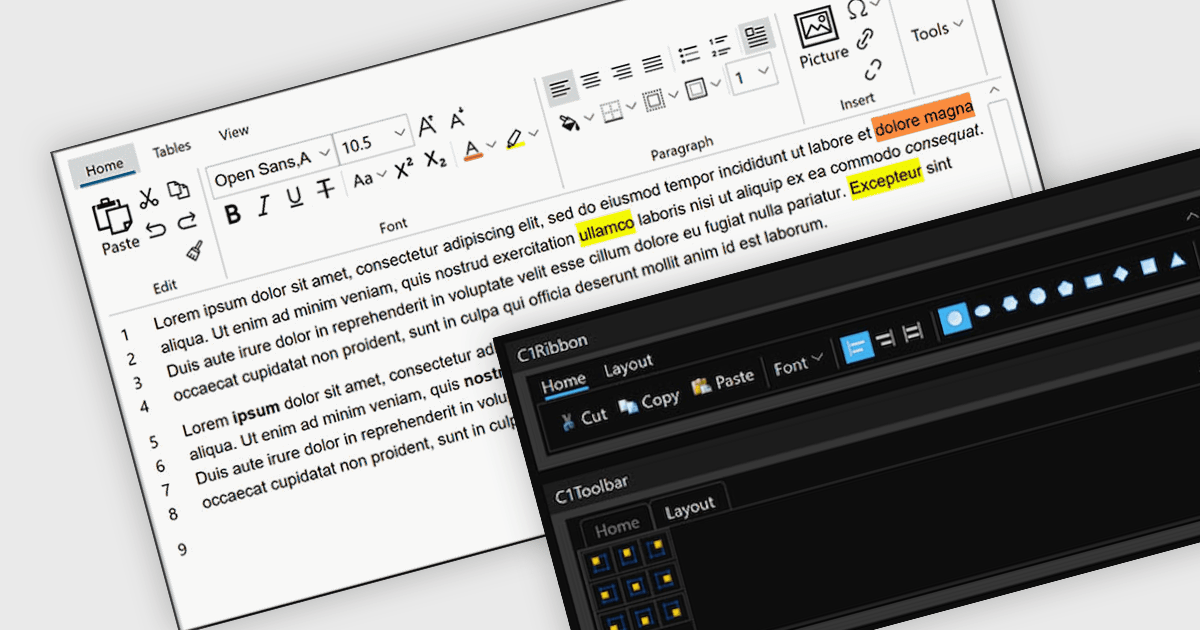
A toolbar user interface component is a horizontal or vertical strip that contains a set of buttons, icons, dropdowns or menus designed to provide quick access to commonly used functions within a software application. These customizable toolbars streamline user interactions by grouping related tools in a consistent and easily accessible location, often near the top or side of the interface. Toolbars enhance productivity by minimizing the number of steps required to perform frequent tasks, improving efficiency, and reducing the need to navigate through deeper menu hierarchies. Such a component also contributes to a cleaner and more organized interface, helping users perform actions more intuitively and with fewer interruptions.
Several WPF user interface suites provide you with toolbars, including:
For an in-depth analysis of features and price, visit our comparison of WPF user interface suites.