


Offizieller Lieferant
Als offizieller und autorisierter Distributor beliefern wir Sie mit legitimen Lizenzen direkt von mehr als 200 Softwareherstellern.
Sehen Sie alle unsere Marken.
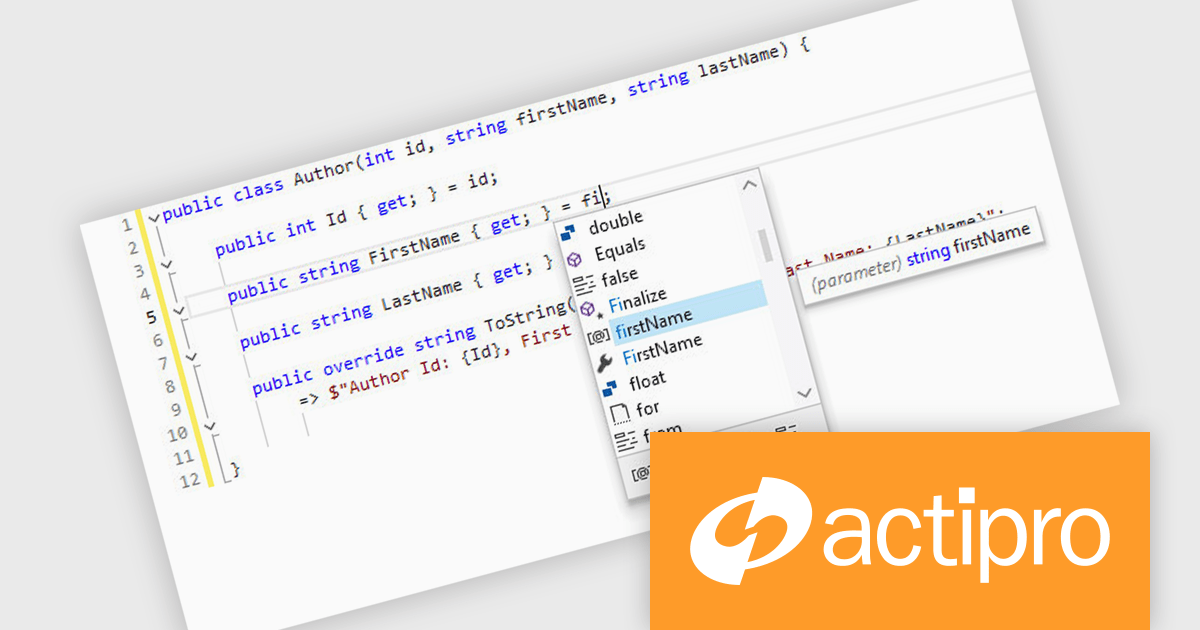
Actipro SyntaxEditor is a sophisticated WPF code editor control designed to provide developers with a seamless way to integrate advanced code editing capabilities into their .NET applications. It offers syntax highlighting for numerous programming languages, code outlining, automated IntelliPrompt (code completion and information tooltips), background parsing, error reporting, and more. This delivers a familiar user experience for developers used to the powerful code editors found in popular IDEs.
The Actipro SyntaxEditor v25.1 update improves the .NET Languages Add-on with full support for C# 13, ensuring every new language construct is parsed correctly and presented accurately in the editor. By incorporating raw string literals, file-scoped namespaces, list patterns, required members and parameter null checking, it allows IntelliSense to provide precise code completions and signature help for the latest API surface. Real-time error detection flags invalid C# 13 syntax, reducing the feedback loop between editing and compilation. Refactoring operations such as renaming, extraction and code generation now understand modern construct semantics to preserve code integrity without manual intervention. This makes it simpler to adopt the most recent C# advancements within any WPF-based IDE or editor.
To see a full list of what's new, see our Actipro SyntaxEditor for WPF release notes.
Actipro SyntaxEditor is licensed per developer and is available as a Perpetual license with 1 year support and maintenance. See our Actipro SyntaxEditor for WPF licensing page for full details.
Actipro SyntaxEditor for WPF is available individually, or as part of Actipro WPF Studio.
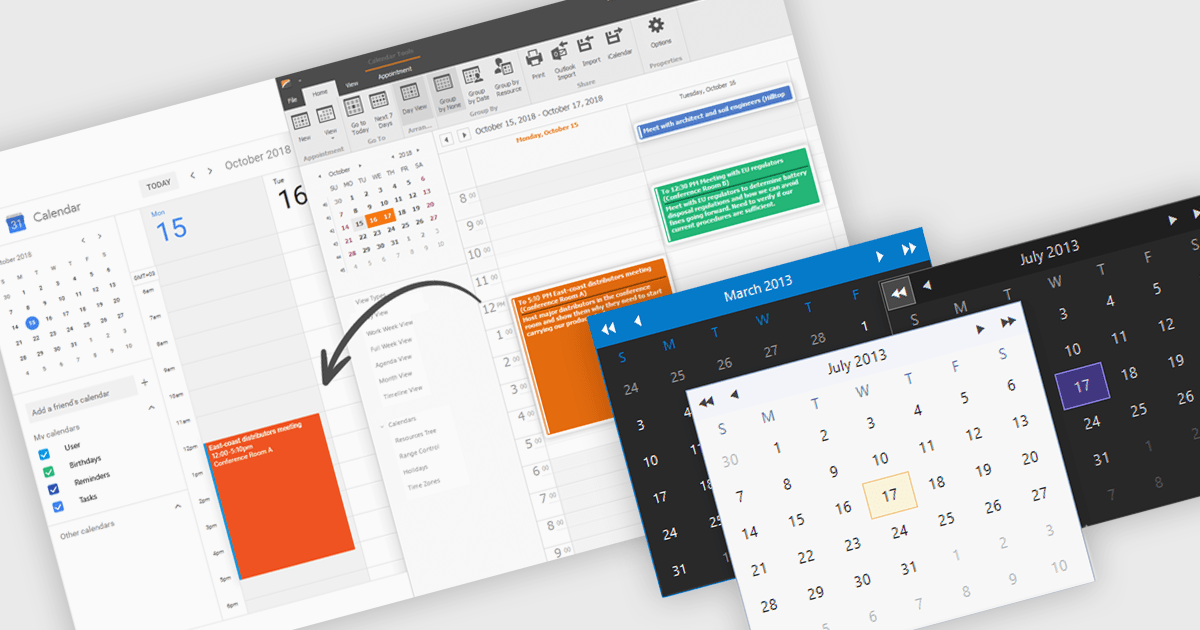
Calendars are specialized components that allow developers to present and manage dates and events directly within their applications. They provide ready-made interfaces for selecting dates and displaying scheduled items while synchronizing with external services such as Microsoft 365 and Google Calendar. Common use cases include online booking systems for reserving resources, shift planning tools for staff schedules, and customer-facing appointment portals in industries like healthcare or personal services. By leveraging these calendar components, teams deliver polished, reliable scheduling experiences with minimal effort.
Several .NET Winforms UI suites offer a calendar component including:
For an in-depth analysis of features and price, visit our .NET Winforms UI suites comparison.

Bunifu Technologies is a leading provider of UI/UX components, design tools and data visualization components for developers building WinForms applications, and for integrating charting functionality. The Bunifu Ultimate Bundle offers a comprehensive suite of premium grids, charts, forms, and navigation components that make it easy to craft visually stunning, user-centric interfaces. By leveraging Bunifu’s expertise, developers can significantly improve the look and feel of their applications while reducing development time, ultimately delivering exceptional user experiences.
With support for Microsoft .NET 9, developers can use Bunifu UI WinForms and BuniCharts to create high quality applications that combine modern user interface elements with high-performance data visualization. This compatibility aligns these components with the latest advancements in the .NET ecosystem, allowing developers to deliver more modern, stable, and future-proof applications without compromising on design or performance.
Bunifu products are licensed per developer and are available in four plans, three of which are annual licenses while the other is perpetual. All plans come with free version updates and Premium support for the active license period. See our Bunifu Ultimate Bundle licensing page for full details.
For more information, see the following product pages:
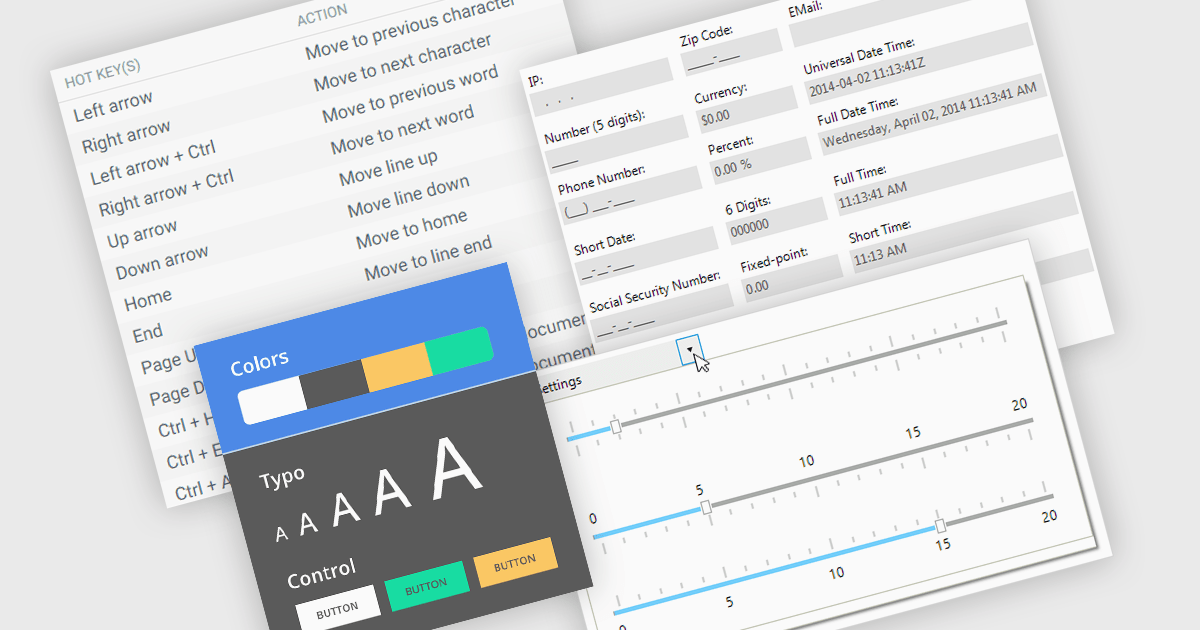
Data input controls with accessibility support are user interface components designed to capture user input, such as text fields, checkboxes, dropdowns, date pickers, and numeric fields, that can be used by anyone, regardless of physical or cognitive limitations. With assistive technologies like screen readers, voice input systems, and keyboard navigation, they ensure that individuals with disabilities or impairments can enter and manipulate data without obstruction. By adhering to accessibility standards like the Web Content Accessibility Guidelines (WCAG) and supporting technologies, these controls help developers deliver user-friendly interfaces that improve user experience for all, and help organizations meet legal and ethical accessibility obligations.
Several WinForms data editor collections include accessibility support, such as:
For an in-depth analysis of features and price, visit our comparison of .NET WinForms data editor collections.
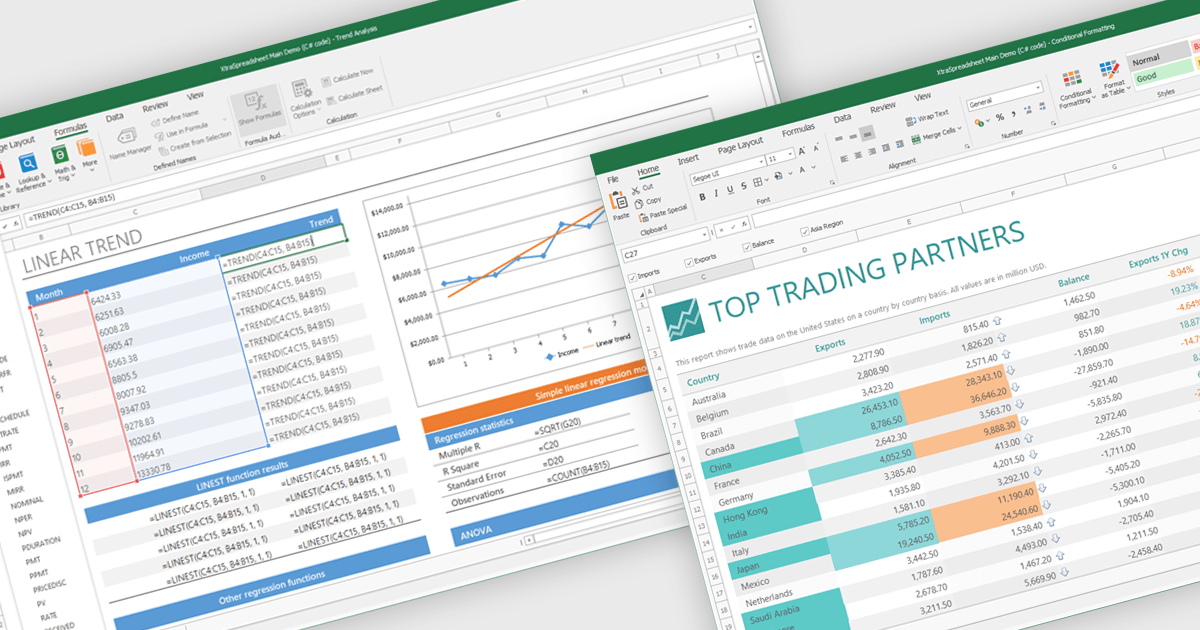
Chart support in a spreadsheet component refers to the ability to create, render, and manipulate various types of charts - such as line, bar, pie, and area charts - all within the spreadsheet environment. This functionality allows spreadsheet developers to present data visually and dynamically, without needing to rely on external charting libraries. The integration of charting capabilities enhances the end-user experience by making complex data more understandable. For developers, this reduces the need for separate visualization components, improves performance through tighter integration, and simplifies the deployment of data-centric applications.
Several .NET Winforms spreadsheet controls offer chart support, including:
For an in-depth analysis of features and price, visit our .NET Winforms spreadsheet controls comparison.


Tel.: (888) 850 9911
Fax: +1 770 250 6199


