


Offizieller Lieferant
Als offizieller und autorisierter Distributor beliefern wir Sie mit legitimen Lizenzen direkt von mehr als 200 Softwareherstellern.
Sehen Sie alle unsere Marken.
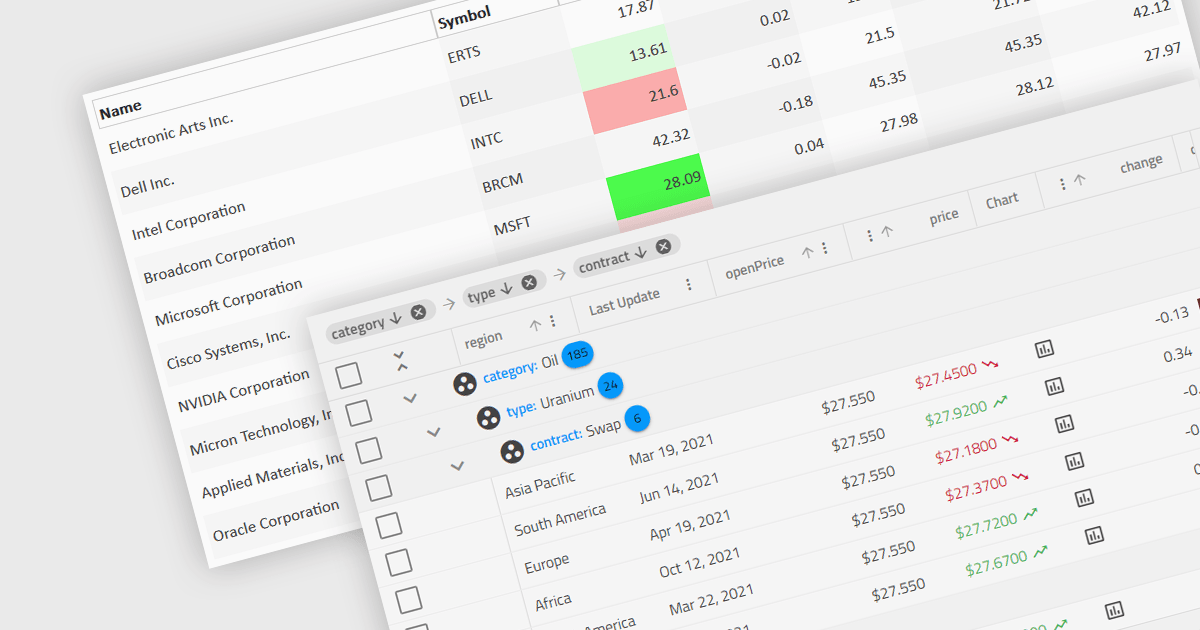
Dynamic updates, or live data rendering, in a data grid is the capability of the grid to automatically refresh and display updated data without the need for manual intervention or full-page reloads. This provides immediate access to the most current data and gives real-time reflections of changes. It therefore improves the user experience, enhancing data accuracy, and minimizing disruptions during data manipulation. Live data reduces the load on network resources by fetching only incremental data changes, and minimizes the computational burden on the client side, improving overall performance. This functionality is critical in applications where real-time data visibility is essential, such as in financial dashboards, live monitoring systems, or inventory management applications.
Several Angular grid components support dynamic updates, including:
For an in-depth analysis of features and price, visit our comparison of Angular grid components.
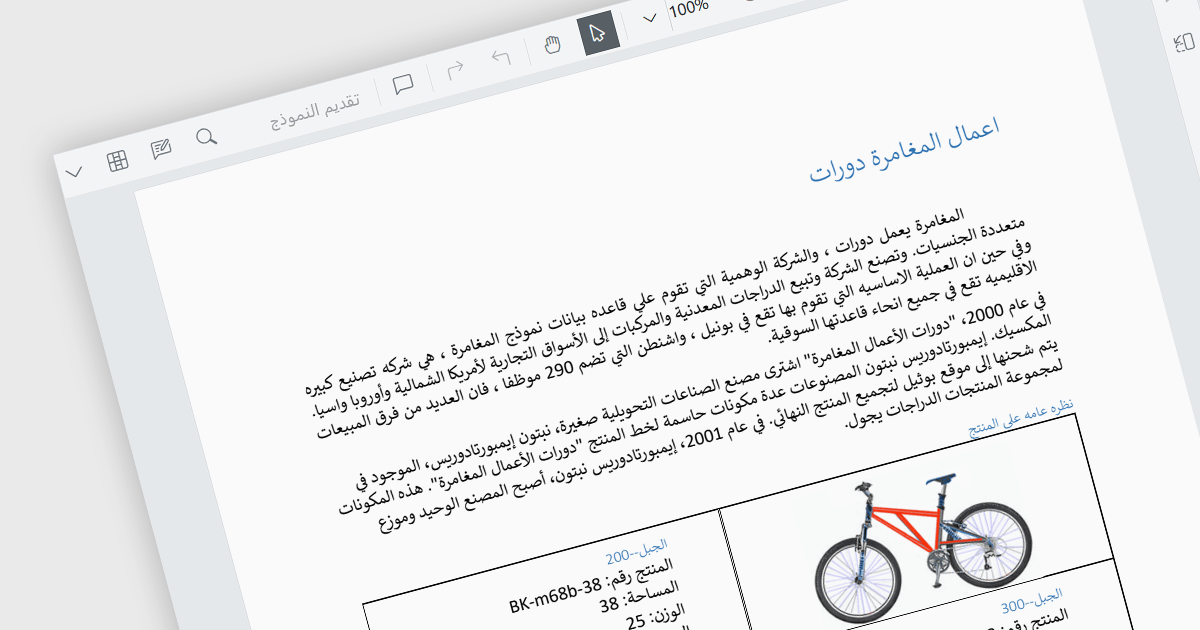
RTL (Right-to-Left) support is the ability to accommodate languages that are read from right to left, such as Arabic, Hebrew, Persian, Urdu, Kashmiri, Pashto, Uighur, Sorani Kurdish, or Sindhi. In a PDF viewer, it ensures the proper display and functionality for PDF documents written in such languages. This includes correctly mirroring the user interface elements, adjusting text flow and maintaining proper alignment, positioning of punctuation etc. within the document itself. RTL support preserves the layout and structure of the document whilst making it easily accessible to users who require said languages. This gives PDF viewing applications more global reach as they can be used by a wider user base.
Several React PDF viewer components include RTL support, including:
For an in-depth analysis of features and price, visit our comparison of React PDF viewer components.
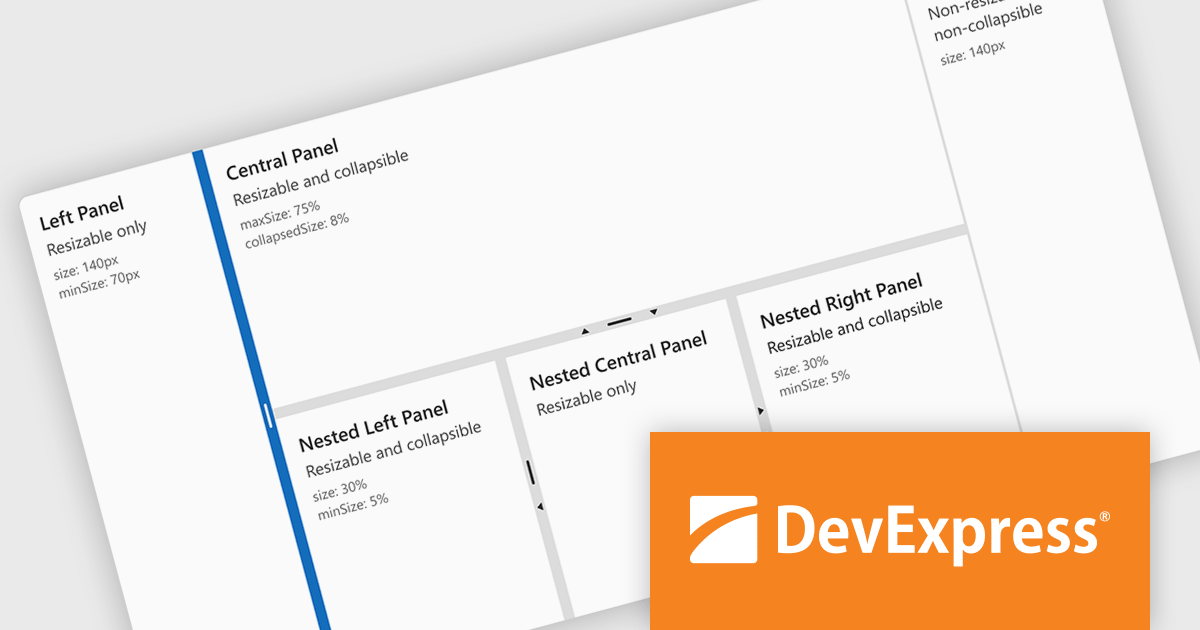
DevExtreme Complete by DevExpress is a collection of high-performance, pre-built UI components designed for web and mobile app development. It offers a rich set of widgets including data grids, charts, editors, and navigation tools that are responsive and work seamlessly across different browsers and devices. DevExtreme Complete allows developers to build feature-rich and user-friendly applications for modern web experiences.
DevExtreme Complete 24.1 adds a new splitter component. This powerful addition allows you to create flexible page layouts with resizable and collapsible panes. Panes can be oriented horizontally or vertically and can contain various content types, including HTML and other DevExtreme components. The splitter offers customization options for handle size, appearance, and keyboard accessibility, making it a powerful tool for building adaptable web applications.
To see a full list of what's new in version 24.1, see our release notes.
DevExtreme Complete is licensed per developer and is available as a Perpetual License with a 12 month support and maintenance subscription. We can supply any DevExtreme Complete license including new subscriptions, subscription renewals, expired subscription renewals, and additional licenses. See our DevExtreme Complete licensing page for full details.
DevExtreme Complete is available to buy in the following products:
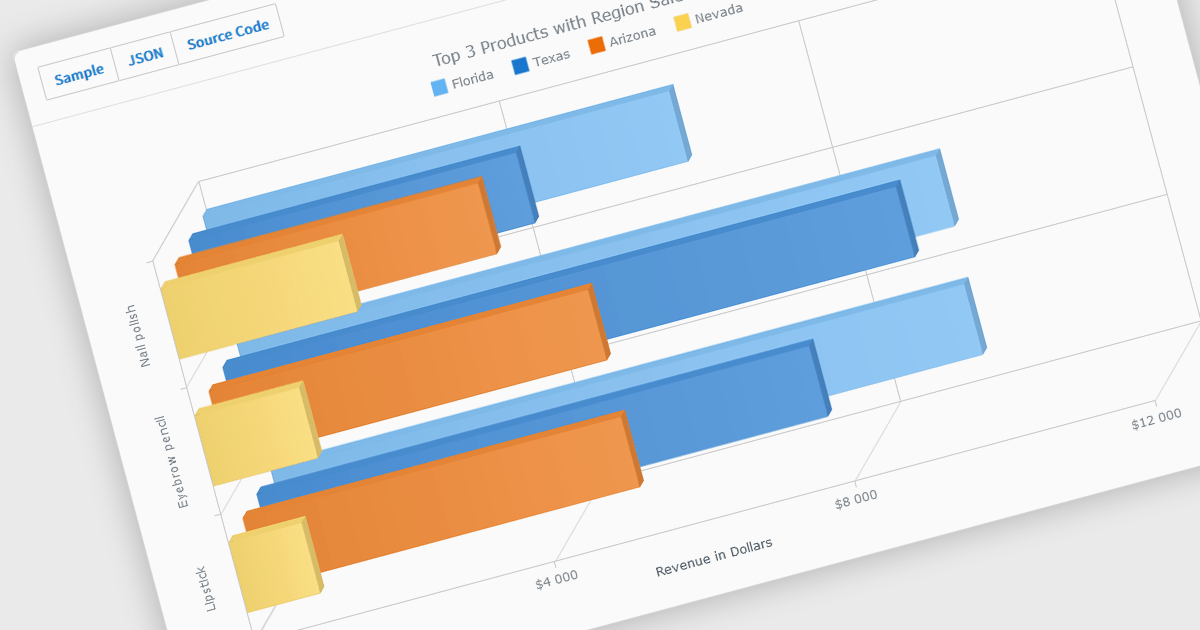
A selection of jQuery chart controls offer 3D capabilities, allowing data visualization to extend beyond the flat plane. This enables a more immersive and engaging user experience, particularly for complex datasets. Three-dimensional charts can be beneficial for highlighting patterns and relationships between multiple variables, making them ideal for scientific visualizations, financial data representation, or showcasing product features in a unique way.
Several jQuery chart controls offer 3D charts including:
For an in-depth analysis of features and price, visit our comparison of jQuery chart controls.
ActiveReportsJS by MESCIUS is a JavaScript reporting toolkit that empowers developers to design and embed interactive reports within web applications. It offers a standalone report designer for crafting reports and a JavaScript report viewer component for seamless integration into web frameworks like React or vanilla JavaScript. This solution streamlines report creation, facilitates data visualization, and delivers a user-friendly report experience.
The ActiveReportsJS 5.0 update modernizes the development experience by refreshing the look and feel of both the Report Designer and Report Viewer components with new icons and colors. This enhances clarity and consistency and improves the design environment. Improved theming capabilities empower you to effortlessly apply pre-defined themes or customize the designer's appearance to match your application's branding, fostering a more cohesive user experience within your web applications.
To see a full list of what's new in 5.0, see our release notes.
ActiveReportsJS is licensed on an annual subscription or perpetual basis and is available as a Single Deployment License for non-commercial use, and as a Single Domain License or Unlimited Domain License for commercial and/or SaaS use. See our ActiveReportsJS licensing page for full details.
Learn more on our ActiveReportsJS product page.


Tel.: (888) 850 9911
Fax: +1 770 250 6199


