








Offizieller Lieferant
Als offizieller und autorisierter Distributor beliefern wir Sie mit legitimen Lizenzen direkt von mehr als 200 Softwareherstellern.
Sehen Sie alle unsere Marken.

A date editor control is a user interface element designed for selecting and entering dates. It typically combines a text field for manual input with a calendar popup for visual selection. Beyond basic date picking, many controls offer features like time selection, range definition, drop-down lists for pre-defined dates, and even input masks for enforcing specific date formats. Commonly found in applications like forms, booking systems, and calendars, date editor controls streamline date input, improving user experience and data accuracy.
Several React data editor collections provide date editors including:
For an in-depth analysis of features and price, visit our React Data Editors comparison.
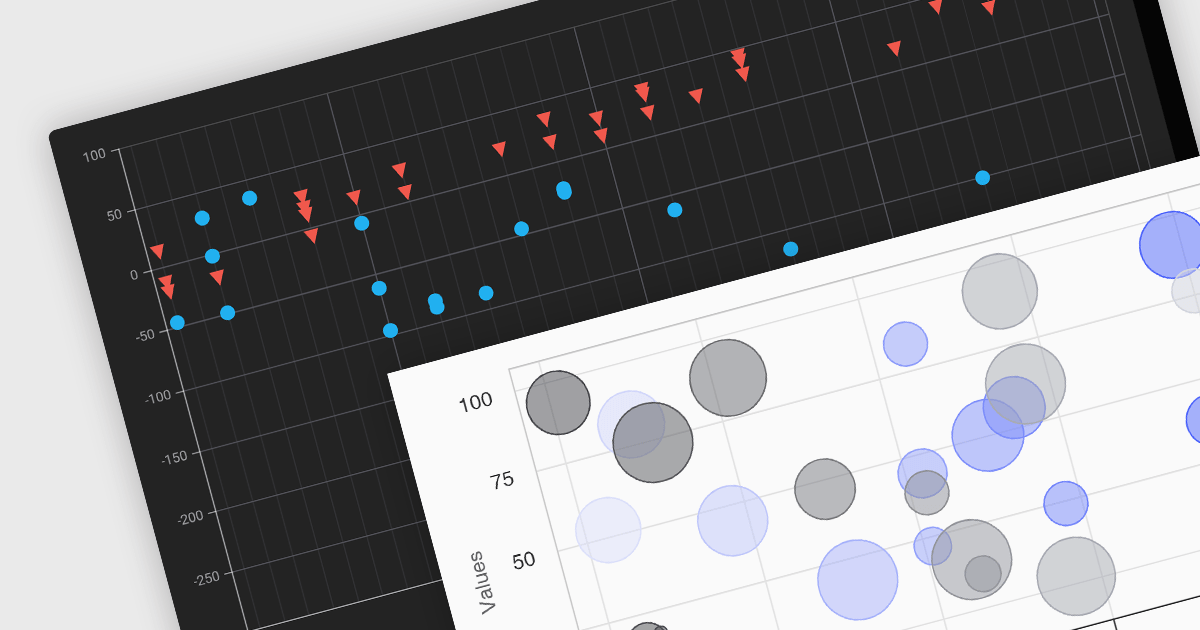
Scatter and bubble charts are used to display data points on a two-dimensional graph. While scatter charts use dots to represent data points, bubble charts add an additional dimension by varying the dot size, often representing volume or intensity. These charts are useful for showing relationships between variables and for identifying patterns or trends in data.
Several Angular chart controls offer scatter and bubble charts including:
For an in-depth analysis of features and price, visit our Angular chart controls comparison.
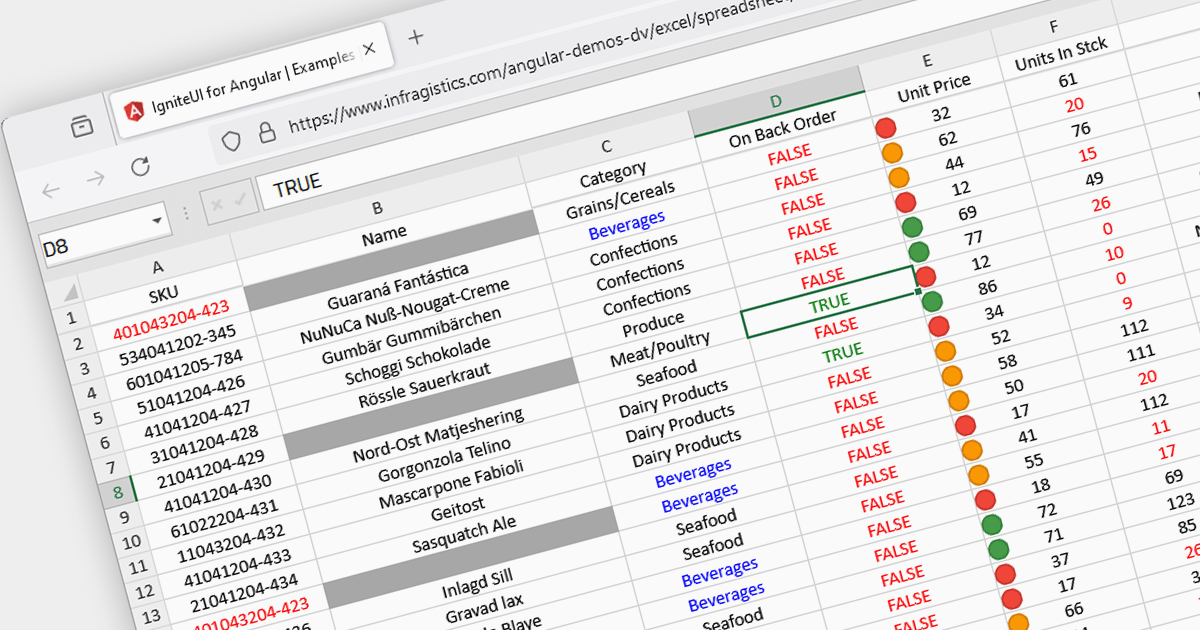
Conditional formatting in spreadsheets automates the visual highlighting of cells or ranges based on predefined criteria. This functionality aids data analysis by rapidly drawing attention to specific values, ranges, or text entries. By employing color scales, gradients, or text changes, conditional formatting helps users identify patterns, exceptions, and trends within large datasets, streamlining the interpretation and communication of key insights.
Several JavaScript spreadsheet controls offer conditional formatting including:
For an in-depth analysis of features and price, visit our comparison of JavaScript spreadsheets.

LightningChart JS Trader is a comprehensive charting solution specifically designed for building high-performance financial and trading applications in JavaScript. It equips developers with a rich set of financial charts, over 100 technical indicators for in-depth analysis, and 30+ drawing tools for visual annotations. Additionally, a fully featured datagrid with sparkline support allows for organized data management and display. This combination empowers developers to create interactive and visually engaging trading dashboards, charting tools, and other financial applications with high performance and extensive customization options.
LightningChart JS Trader features include:
LightningChart JS Trader is licensed per developer, per application, per year. The annual license includes technical support and product updates for one year. To continue using the software you will need to renew your license each year. There are three editions to choose from; Basic, Plus and Ultimate which offer different levels of functionality and distribution rights. See our LightningChart JS Trader Licensing page for full details.
For more information, visit our LightningChart JS Trader product page.
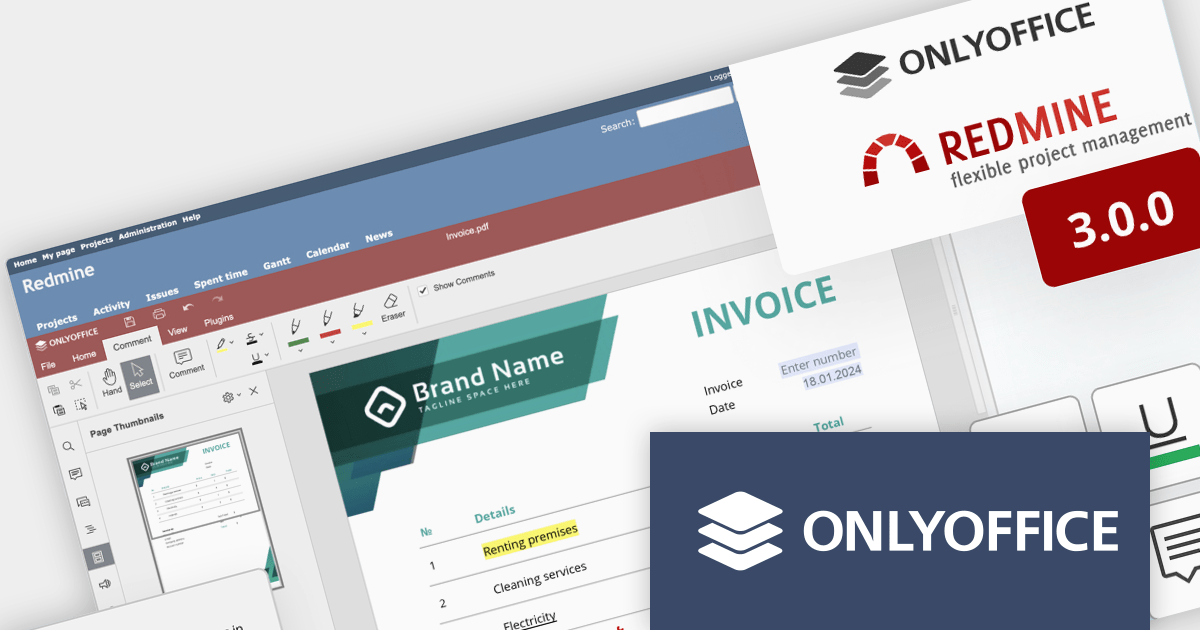
ONLYOFFICE Docs Enterprise Edition with Redmine Connector combines an online document editor with a seamless integration for Redmine, the Ruby on Rails-based project management hub. This allows teams to create, view, edit, and collaborate on spreadsheets, presentations, and text files online, directly within Redmine, boosting efficiency and eliminating the need for file switching.
ONLYOFFICE Redmine connector v3.0.0 expands the list of file formats that are available for editing. Previous releases supported DOCX, XLSX, PPTX, DOCXF and OFORM, but the latest update allows you to use ONLYOFFICE Docs directly within Redmine, to edit DOCM, DOTM, DOTX, XLSM, and XLTM files. The following formats may also be opened for editing by checking them in the format settings, though please note that data loss may occur due to format restrictions: EPUB, FB2, HTML, ODT, OTT, RTF, TXT, CSV, OTS, ODS, and ODP.
To see a full list of what's new in v7.5.1 (3.0.0), see our release notes.
ONLYOFFICE Docs Enterprise Edition with Redmine Connector is licensed per server and is available as an annual license with 1 year of support and updates, or as a perpetual license with 3 years of support and updates. See our ONLYOFFICE Redmine connector licensing page for full details.
For more information, see our ONLYOFFICE Redmine connector product page.





Tel.: (888) 850 9911
Fax: +1 770 250 6199


