


Offizieller Lieferant
Als offizieller und autorisierter Distributor beliefern wir Sie mit legitimen Lizenzen direkt von mehr als 200 Softwareherstellern.
Sehen Sie alle unsere Marken.
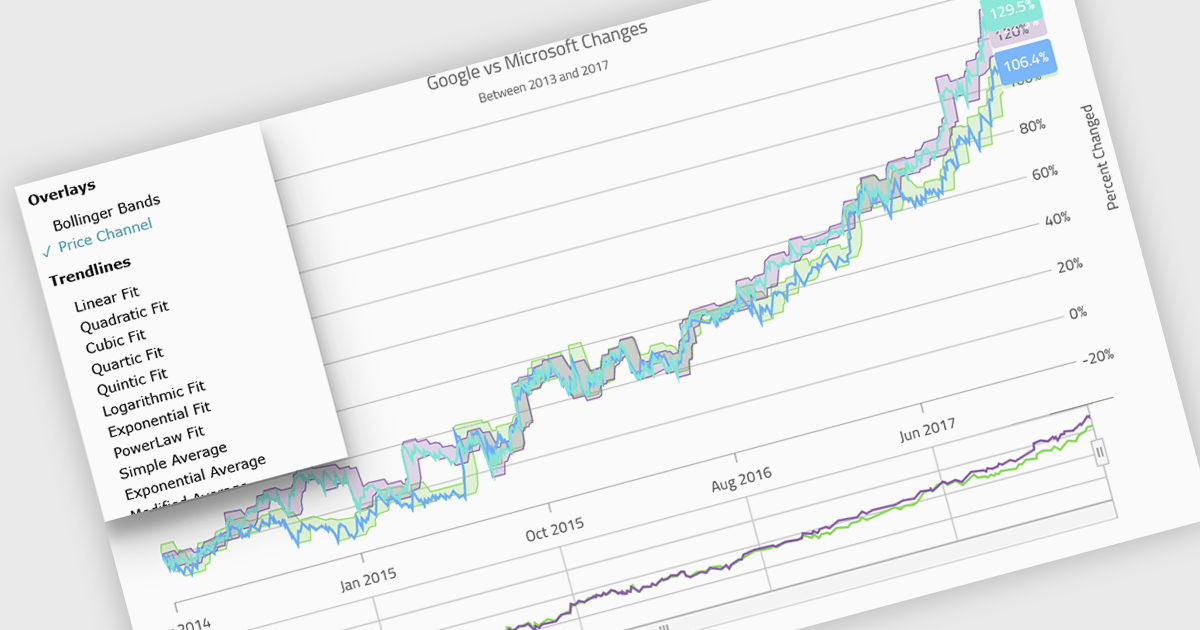
Indicators in a chart component are visual tools used to represent specific statistical or mathematical calculations directly on the chart, often to highlight trends, patterns, or key thresholds within the underlying data. Common in financial and analytical applications, indicators can include elements like moving averages, Bollinger Bands, or threshold lines. For software developers, implementing indicators provides a powerful way to enhance data interpretation by allowing users to see meaningful context and actionable insights without needing to leave the chart interface. This improves decision-making and supports more interactive and informative visualizations across a wide range of use cases.
Several .NET Blazor charting controls support indicators including:
For an in-depth analysis of features and price, visit our comparison of .NET Blazor Chart Controls.
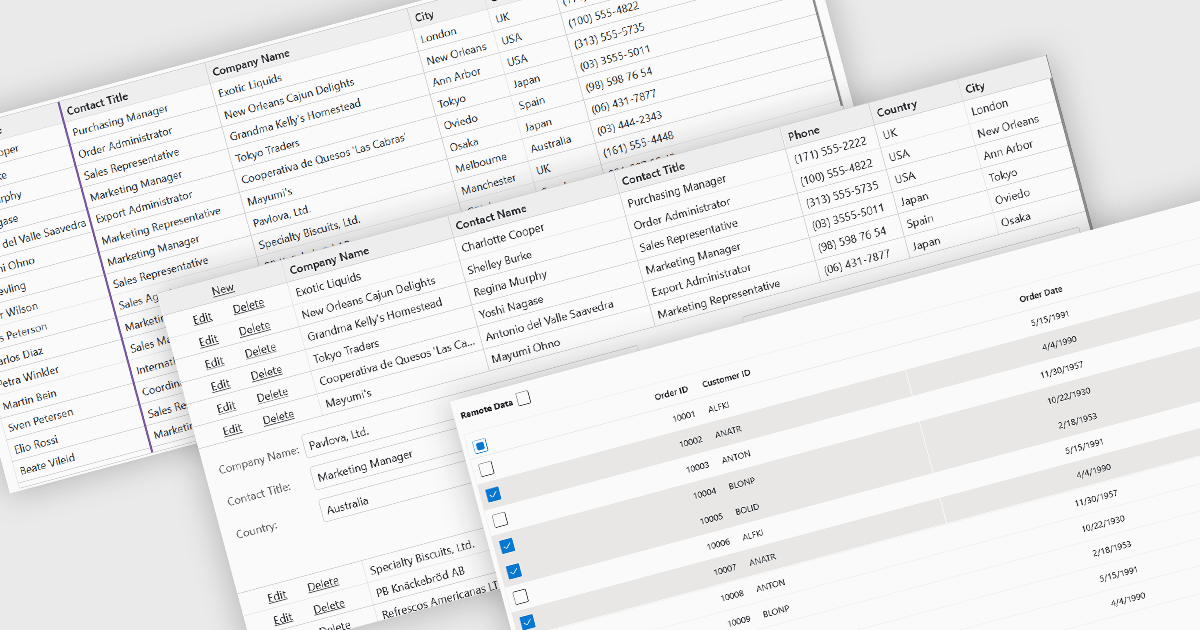
Row and column features form the core of modern grid components, enabling users to view, navigate, and manipulate tabular data efficiently. These capabilities improve usability and help developers present information in a structured, interactive format suited to many types of applications. By offering clear ways to organise, edit, and inspect information, row and column features allow users to work more effectively while maintaining control over how content is displayed.
Common features include:
For an in-depth analysis of features and price, visit our Blazor grid components comparison.
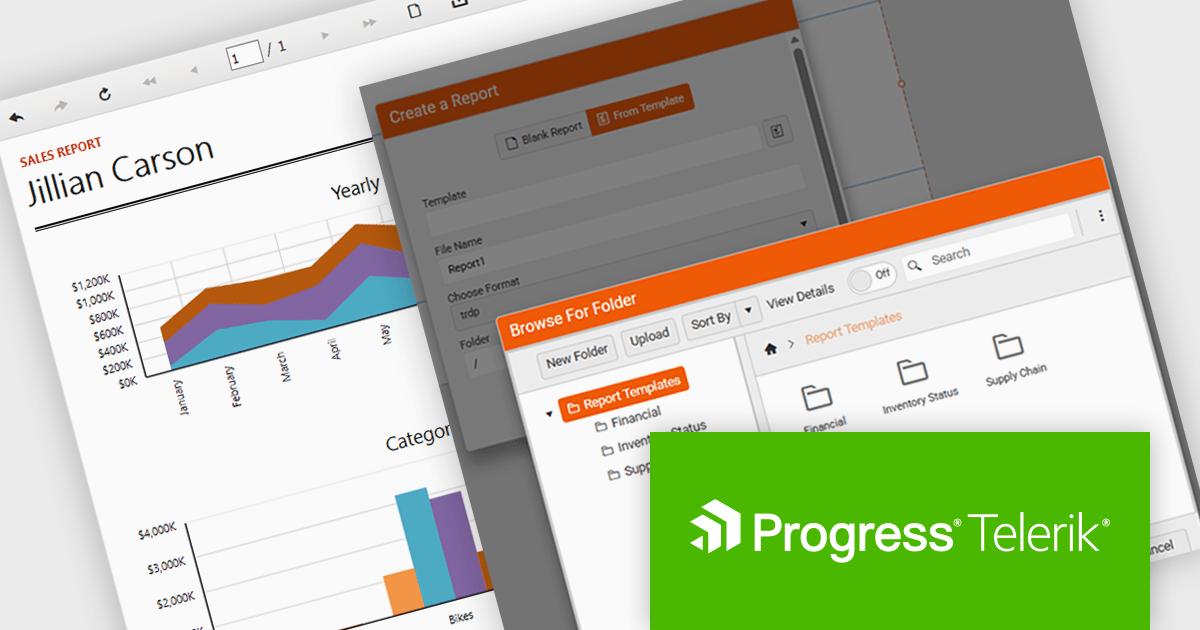
Telerik Reporting is a comprehensive and lightweight embedded reporting tool for .NET web and desktop applications. It enables developers and reporting users to create, design, and export visually appealing, interactive, and reusable reports to effectively present analytical and business data. It supports various technologies, including ASP.NET Core, Blazor, ASP.NET MVC, ASP.NET AJAX, HTML5/JS, Angular, WPF, WinForms, and WinUI.
The Telerik Reporting 2025 Q4 update introduces customizable report templates in the Web Report Designer, giving developers a faster and more controlled way to produce consistent, production-ready reports. By allowing teams to define, save and reuse templates that include predefined layout structures, styling rules and data components, the feature reduces repetitive setup work, maintains uniform design standards across projects and ensures every new report begins with a reliable, compliant foundation.
To see a full list of what's new in 2025 Q4 (19.3.25.1111), see our release notes.
Telerik Reporting is licensed per developer and is available as a perpetual license with a one year support subscription, which is offered in three tiers: Lite, Priority or Ultimate. See our Telerik Reporting licensing page for full details.
Telerik Reporting is available to buy in the following products:
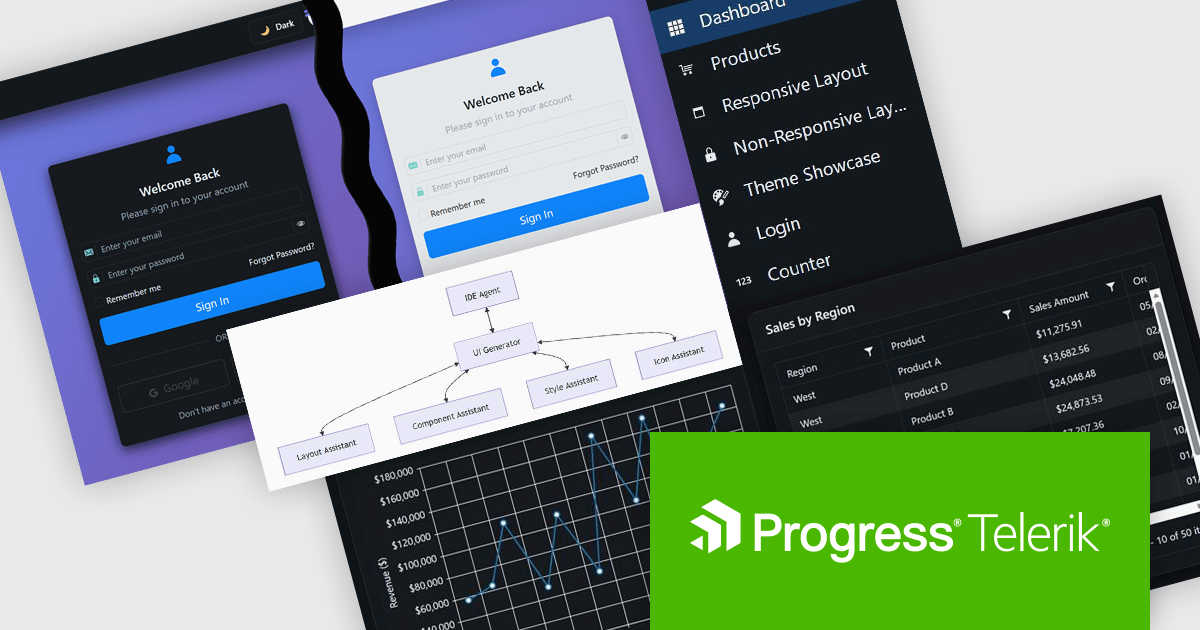
DevCraft by Telerik is a comprehensive AI-powered suite of more than 1,250 UI components and development tools designed for building modern web, desktop, and mobile applications using .NET and JavaScript frameworks. It includes reporting and report management solutions, automated testing and mocking tools, and document processing libraries, as well as a wide range of professionally designed user interface controls from the Telerik and Kendo UI suites. DevCraft enables developers to create feature-rich, high-performance applications with consistent design and user experience, delivering enterprise-level, scalable, and maintainable software solutions.
The Telerik DevCraft 2025 Q4 update adds the Agentic UI Generator which enables developers to translate natural language prompts directly into fully‑scaffolded, production‑ready user interfaces built on the Telerik and Kendo UI component libraries. It includes all the functionality of the AI Coding Assistant, as well as handling layouts, styling, responsive behavior, accessibility best‑practices, data‑bindings and theming from an MCP server that works in any AI-enabled IDE, so developers can remain in their familiar IDE and focus their effort on domain logic rather than boilerplate. This feature is only available as part of DevCraft Complete and DevCraft Ultimate subscription licenses and currently supports Blazor, Angular and React.
To see a full list of what's new in DevCraft 2025 Q4, see our release notes.
Telerik DevCraft is licensed per developer and has two licensing models: an annual Subscription License and a Perpetual License. The Subscription license provides access to the latest product updates, technical support, and exclusive benefits for a flat annual fee, and must be renewed to continue using the software. The Perpetual license is a one-time purchase granting access to the current released version and includes a one-year subscription for product updates and technical support. After this initial period, users can choose to renew the subscription element to continue receiving updates and support; otherwise, they may continue using the installed version available during their active subscription term but will forgo future updates and support. See our Telerik DevCraft Ultimate licensing page for full details.
For more information, see our product pages:
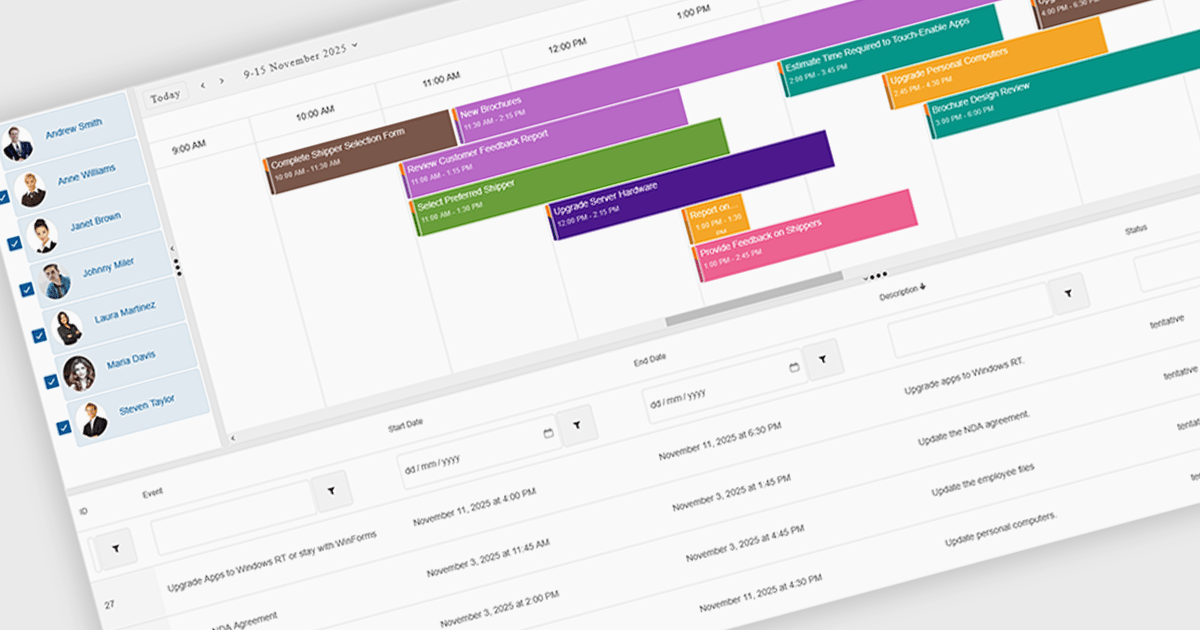
Scheduling components in UI suites provide a visual, interactive way to manage time-based data, with features such as multi-view calendars, drag-and-drop editing, recurrence rules, and group scheduling to simplify planning. They let organizations display daily, weekly, monthly, or timeline views, compare team availability, and tailor the interface to match branding or workflows. Integrated with backend data sources, scheduling components improve clarity, reduce conflicts, and save time across use cases like meeting booking, project management, staff coordination, and customer appointments.
Several .NET Blazor User Interface suites offer scheduling controls including:
For an in-depth analysis of features and price, visit our .NET Blazor UI suites comparison.


Tel.: (888) 850 9911
Fax: +1 770 250 6199


